
RETIREMENT INCOME AND TRANSFER PAYMENTS CAN BE USED TO MEASURE ECONOMIC FRAGILITY
Gross Domestic Product (GDP) is a common way to measure the size and strength of economies. GDP has four components; investment, government spending, net exports, and consumption, which constitutes nearly 70% of GDP in the US and is driven by a wide range of income and wealth sources. Some of those sources are not as durable as others.
For example, legacy industrial-era private pensions may be fueling retail sales and creating retail and warehouse jobs in rustbelt metros but may not be sustainable going forward. In addition, but to a lesser extent, the economic contribution of Senior Transfer Payments (STP), which include Social Security retirement and Medicare benefits, may be reduced as the large generation of baby boomer retirees ages out of the peak retiree spending years and is replaced by a smaller subsequent generation. Depressed areas may not be able to weather such pension and STP losses as well as more prosperous areas.
Private pensions1 are a component of the US census category of “Retirement Income” which includes retirement, survivor, or disability income.2 Transfer Payments include all transfer payments provided by government(s), nonprofit, and business sources, as defined by the US Bureau of Economic Analysis (BEA). We have characterized transfer payments into two categories: Senior Transfer Payments and Assistance Transfer Payments.3 These account for 96% of all transfer payments, and as steady sources of income, they retail in general, and entertainment retail (e.g., theater, restaurant) establishments in particular.
A metro that has relatively high GDP may be weaker than it appears if a significant part of its income comes from retirement income or STP. In some ways, many de-industrialized metros of the Midwest and the Northeast are living off the past. Detroit, the nation’s 14th largest economy, draws 6.6% of total household income from retirement income – the 18th highest in the nation amongst metros with more than 750,000 people. STP represented 12% of 2017 personal income in Detroit; the tenth highest in the nation.
Cleveland had the 28th highest GDP in the US in 2017, however, retirement income represented 7.0% of total household income, the 13th highest in the nation amongst metros with over 750,000 people. STP was 11.1% of 2017 personal income in Cleveland, 17th highest in the nation.
Buffalo had the 54th highest GDP in the US in 2017, however, even that level may not be sustainable considering its reliance on Retirement Income and Transfer Payments. Retirement Income was 7.5% of total household income, the ninth highest in the nation amongst metros with over 750,000 people. STP was 12.1% of 2017 personal income in Buffalo, ninth highest in the nation.
RETIREMENT INCOME
In order to gain insight into legacy private pensions, which are phasing out as high-paying manufacturing-era disbursements become a thing of the past, we analyzed US Census data for retirement income defined generally as pensions and retirement account fund disbursements.
In many de-industrializing metros of the Midwest and the Northeast, residents are still receiving high paying manufacturing pensions that are no longer available to current workers. As these relatively affluent retirees pass away, an irreplaceable source of local income will be lost to the regional economy.
The Midwest changed from a vibrant middle-class job mecca to the center of American de-industrialization as the share of Americans working in manufacturing declined from 30% in 1950 to approximately 8.5% in 2017. The number of manufacturing jobs in the 14 largest Midwestern metros declined 41% between 1970 and 2017 while the share of Midwesterners employed in manufacturing declined from 26% to 10% during the same time period. More recently, the number of manufacturing jobs in the 14 largest Midwestern metros declined 29% between 2000 and 2017.4
In the Midwest, the manufacturing economy is a shadow of what it once was – but the region continues to benefit from legacy private pensions, Social Security, and private and public healthcare. As manufacturing and private sector unionization declined, generous private pensions declined. Pubic pensions and employment have remained relatively strong, especially in the Midwest and the Northeast, which have a legacy of a highly unionized workforce and historically generous packages. Although there is fiscal risk, there may not be the political/legal will or ability to meaningfully curtail benefits.

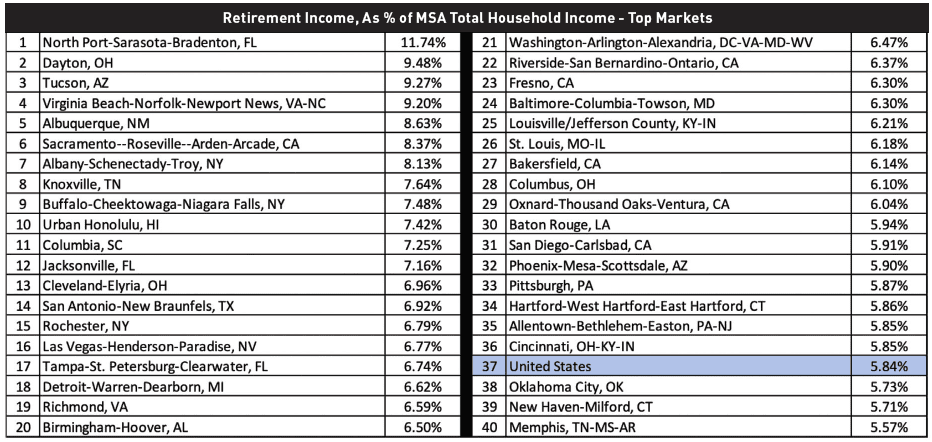
Legacy industrial metros such as Dayton (ranked 2nd in terms of share of metro income coming from retirement income at 9.5% of metro income), Buffalo (9th, 7.5%), Cleveland (13th, 7.0%), Rochester (15th, 6.8%), and Detroit (18th, 6.6%) are disproportionally reliant on pensions and retirement accounts and are at the most risk, as manufacturing-era private pension recipients leave this world.
Retirement havens such as North Port-Sarasota-Bradenton, FL (1st, 11.7%), Tucson (3rd, 9.3%), Albuquerque (5th, 8.6%) and Las Vegas (16th, 6.8%) are exposed, but at significantly lower risk, as their population of those aged 65 of older is being replenished by senior net domestic migration, and their retirement income is less reliant on private pensions.
There are also retirement havens with a heavy concentration of armed forces retirees due to the presence of military bases. These include Virginia Beach (4th, 9.2%), Honolulu (10th, 7.4%), Columbia, SC (11th, 7.3%), Jacksonville, FL (12th, 7.2%), San Antonio (14th, 6.9%), and Tampa (17th, 6.7%). The income base of these metros is more secure as they have the benefit of military retiree replenishment.
Many state capitals have residents collecting public pensions which have proved more resistant to reform and cutbacks than private pensions. These include Sacramento, CA (6th, 8.4%), Albany, NY (7th, 8.1%), and Columbia, SC (11th, 7.3%).
The metros with the lowest retirement income as a share of total income include wealthy conurbations such as San Jose- Silicon Valley (75th, 3%), Stamford-Fairfield County (73rd, 3.5%), Boston (71st, 4%), San Francisco (67th, 4.2), and Seattle (64th, 4.3%). These metros also include relatively youthful cities such as Houston (74th, 3.4%), Dallas (72rd, 3.7%), and Salt Lake City (69th, 4%). Metros with relatively low median income but high Gini ratios/income concentration5 such as Los Angeles (66th, 4.3%) and Miami (65th, 4.3%) are also included in the lower quadrant. The lower half of the Retirement Income exposure spectrum is not surprisingly also occupied by fast growing, young, educated, tech-oriented markets such as Nashville (60th, 4.5%), Raleigh (58th, 4.6%) Austin (57th, 4.6%) and Denver (55th, 4.6%).
Source: US Census Bureau; New York Life Real Estate Investors; as of 2017
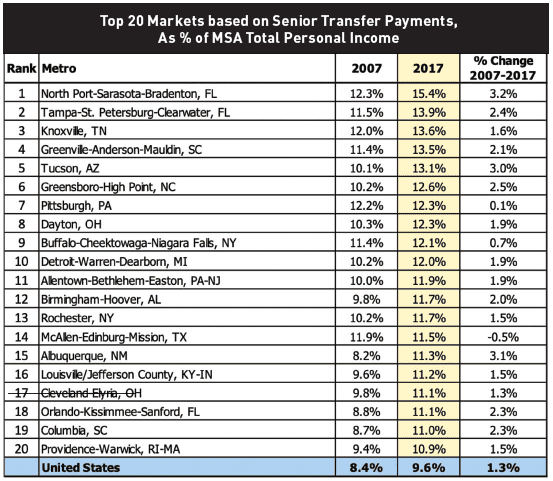
SENIOR TRANSFER PAYMENTS
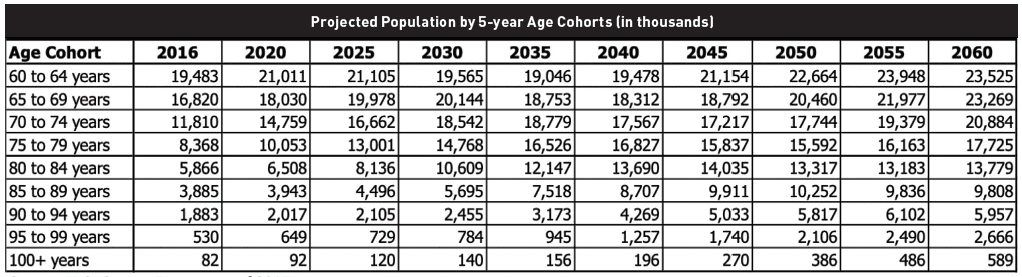
STP accounts for 9.6% of total personal income in the US, and accounts for 56.7% of total transfer payment outlays. The number of seniors as a share of the total population will grow and certain regions, which have fewer working citizens than other parts of the US, will become more reliant on Social Security and Medicare payments. Although this type of income is considered relatively stable and not subject to loss when the unemployment rate goes up, it could dissipate if there are cuts to the program.
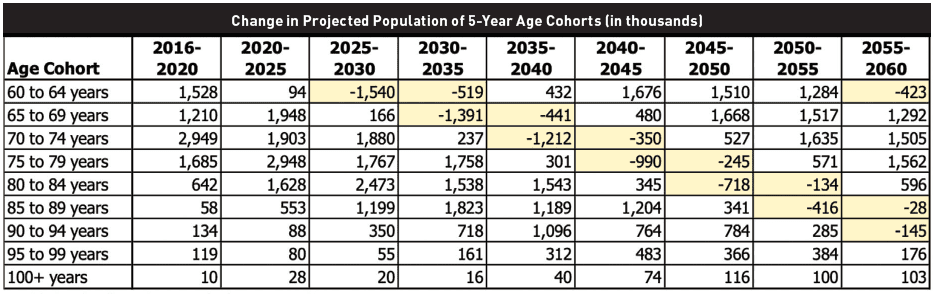
Amongst those over 65 years of age, spending on food, clothing, and entertainment is most significant amongst those aged 65-75. As the large Baby Boomer generation phases out of the 65-75-year age category (as the smaller Generation X phases in), spending on food, clothing and entertainment should decrease for this age category, impacting retail and warehouse distribution facilities.
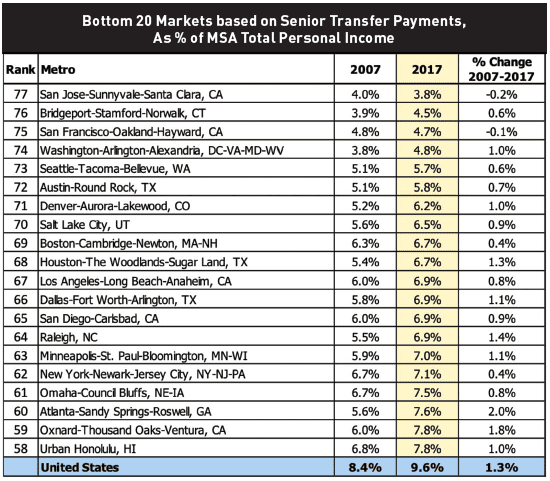
Retirement communities such as Northport-Sarasota-Bradenton and Tampa-St. Petersburg-Clearwater have a high percentage of seniors and unsurprisingly lead the nation in STPs. Unlike the Midwest, this type of place, attractive to migrating seniors, may be self-replenishing in this stable income source.
More affluent retirees rely less on STP. Tech-job centric metros have higher paying jobs and are demographically skewed toward the young. Fairfield County, Connecticut is included because it is a wealthy area that includes Greenwich, and has very high income concentration, as evidenced by having the highest Gini score in the nation.
Retirement Income and STP reveal a great deal about the economic vitality of metro areas. The private pension component of Retirement Income is the most precarious income source and the geographic areas most at risk are former industrial powerhouse metros such as Buffalo, Detroit, Cleveland, Dayton, and Rochester. As the generation of high-paying private pension recipients moves on, these and similar metros will lose a vital consumption catalyst. Even disproportionate exposure to STP could signal future problems for metros especially during the period in which the smaller Generation X replaces later Baby Boomers in the 65-75 age category. Metros least exposed to private pensions and STPs are some of the more prosperous, tech-oriented, and demographically vibrant metros in the US, and include San Jose, Fairfield County, CT, Seattle, Boston, San Francisco, Houston, Dallas, and Salt Lake City.
—
ABOUT THE AUTHORS
Stewart Rubin is Senior Director and Head of Strategy and Research, and Dakota Firenze is an Associate, for New York Life Real Estate Investors, a division of NYL Investors LLC, a wholly-owned subsidiary of New York Life Insurance Company.
NOTES
1. This is the most at-risk form of income. There are other components such as public pensions and retirement plans that are more sustainable.
2. Retirement, survivor, or disability income includes (1) regular income from a company pension, union pension, Federal government pension, state government pension, local government pension, US military pension, KEOGH retirement plan, SEP (Simplified Employee Pension) or any other type of pension, retirement account or annuity such as IRA, ROTH IRA, 401(k) or 403(b); (2) survivor income which is paid to spouses or children of a deceased person; (3) regular income from a disability pension paid to those who are unable to work due to a disability from companies or unions; federal, state, or local government; and the US military. It does not include Social Security or income that is “rolled over” or reinvested in another retirement account.
3. We did not include Military Transfer Payments (MTP) which includes military medical insurance benefits, and veterans’ benefits, as defined by the US BEA but does not include military wages. MTP accounts for only 4% of total transfer payment outlays and 0.67% of total personal income in the US.
4. During the recovery from the global financial crisis, the number of manufacturing jobs in the 14 largest Midwestern metros increased 10.85% between 2010 and 2017.
5. According to the US Census definition, the Gini coefficient incorporates the detailed shares data into a single statistic, which summarizes the dispersion of income across the entire income distribution. The Gini coefficient ranges from 0, indicating perfect equality (where everyone receives an equal share), to 1, perfect inequality (where only one recipient or group of recipients receives all the income). The Gini is based on the difference between the Lorenz curve (the observed cumulative income distribution) and the notion of a perfectly equal income distribution.
THIS ARTICLE ORIGINALLY APPEARED IN SUMMIT: ISSUE #2
—