
Multi-national capital and US cap rate compression is driven by the same force
Investment activity by cross-border investors in the US has totaled $474.2b over the last decade. This capital flow has come at a time when capitalization rates in the US have hit record low levels. The cap rate compression does not necessarily follow from the cross-border flow of capital. Both forces draw from the same well.
In talks I have given throughout the US over the last decade, in every market there is some local appraiser who will stand up in the question and answer period and note that there must be some problem with the current market as they have never seen cap rates as low as they are now in over the last 35 years of practice. The global economy is a different beast today as is commercial real estate as an asset class.
From 2019, 35 years ago was 1984, a time period when a good portion of the global labor market was locked behind the Iron Curtain, inflation expectations were notably higher, and we all feared nuclear annihilation. As shown in the chart, interest rate declines over the last 35 years have come at a time of significant changes in the global economy. The last time interest rates were so low was before the surge in US inflation from the fiscal challenges of the Vietnam war and the end of gold convertibility.
LONG-RUN AVERAGE INTEREST RATES MEAN LITTLE WITHOUT STRUCTURAL CONTEXT
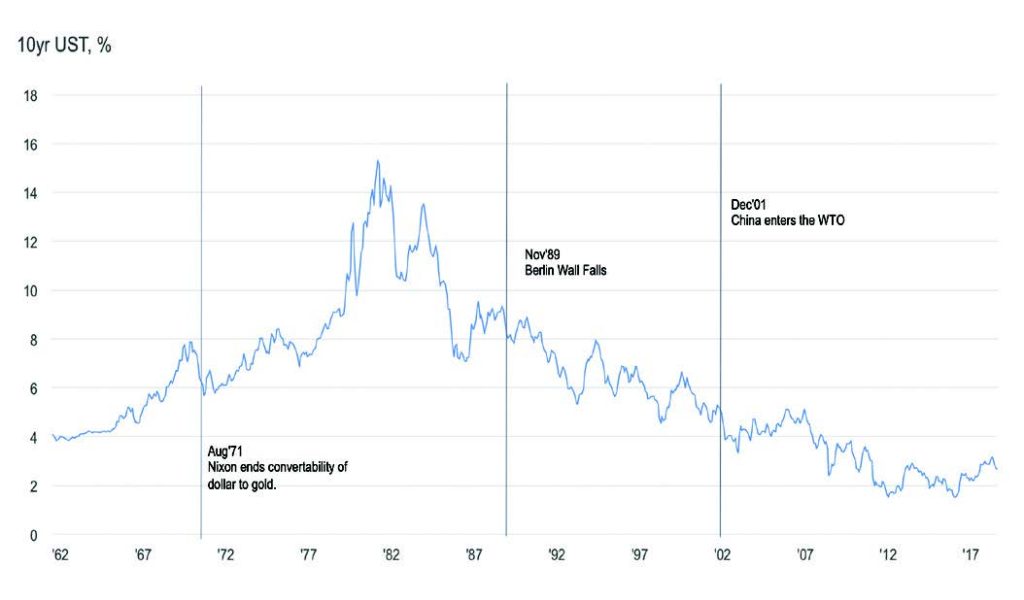
Those appraisers drawing their expectations about the current market from their experiences over that period were not taking into account the vast structural changes in the global economy throughout their careers. There is a tendency we all have to form expectations on how trends will revert back to some average level. This sort of mean reversion is not a bad way to form expectations if there are market constraints bringing something back to “normal”. Putting on blinders with respect to changes over time though will lead one to overestimate what is a normal level for the 10 year US Treasury rate as well as cap rates.
Another important distinction in the commercial real estate market today is the availability of information. This change is impacting real estate practice globally.
Looking back 35 years ago one might be able to get data on performance of real estate assets in another city by way of the post office, or if you were lucky, fax machines. Investment managers in the US had large research departments dedicated solely to collecting rent, vacancy and pricing data by hook or by crook. Today by contrast, market participants sometime complain that they face the challenge of digesting all the different data available in the marketplace.
Commercial real estate assets are inherently local. One cannot pick up an office building in London for instance and ship the beams and curtain wall to Shenzhen. One could, but such a move would be cost prohibitive. The performance of commercial real estate assets is a function of regional economies and local features. In our not so distant past, real estate practice would vary in locations worldwide, for as noted, information transfer between cities was limited. Even today that difference in practice is still seen with some global cities quoting a gross cap rate (or yield if you call it that) while others quote net figures.
Structural changes in the global economy and greater information access and market transparency worldwide have changed investor perceptions of risk in commercial real estate. The real challenge though is understanding the difference between transient and structural changes in the perceptions of risk. Transient changes in risk perception, have at times, flooded markets with capital from overseas locations.
The impact that cross-border capital has on the market is, at times, difficult to discern as there are so many moving parts to the global system of capital flows.
Looking back again to 1984, Japanese investors were discovering the yield opportunities on offer in US commercial real estate investments. At the time, I was not analyzing real estate trends so much as trying to figure out what college to attend. However, drawing from the work of predecessors in this field, I know that Bretrand Renaud of the World Bank generated a study in the 1990s looking at the factors which drove these Japanese investors to take unusual risks for trophy commercial real estate assets in the US.
Renaud notes that the Plaza Accords realigned the exchange rates between the G7 countries and inflated the currency in Japan which in turn inflated asset prices, particularly land prices. Japanese investors were able to use their land holdings in Japan as collateral to obtain bank loans which they used to buy assets overseas.
Market participants active at the time recount stories of Japanese investors paying record low cap rates for assets, but happily so. The income generated from the investments in the US looked great for a time. As land prices fell and loans came due, those investors had to sell assets at discounted prices to preserve their holdings back home.
The lesson to draw from that period is that the capital flow from Japan to the US was not sustainable as the forces driving the changes in risk perception were transient. A low cap rate for an office tower might not have seemed like a good idea but for the temporary realignment in exchange rates.
That experience of the Japanese investors is often presented as the prototype of cross-border investment activity. The argument is that big, dumb money moves to a country and pushes down cap rates before retreating with massive losses. Not all changes in risk perception are transient, however. The structural changes in the global economy and information availability have driven global capital flows as well.
Over the last decade there has been an upswing in the net investment by cross-border investors into US commercial real estate. Net investment meaning what these investors bought, less what they sold. At the same time as this expansion of net investment activity by cross-border investors, cap rates compressed to record low levels. The popular argument is that this cap rate compression was driven by the capital flows.
NET INVESTMENT BY CROSS-BORDER INVESTMENT AND CAP RATE COMPRESSION
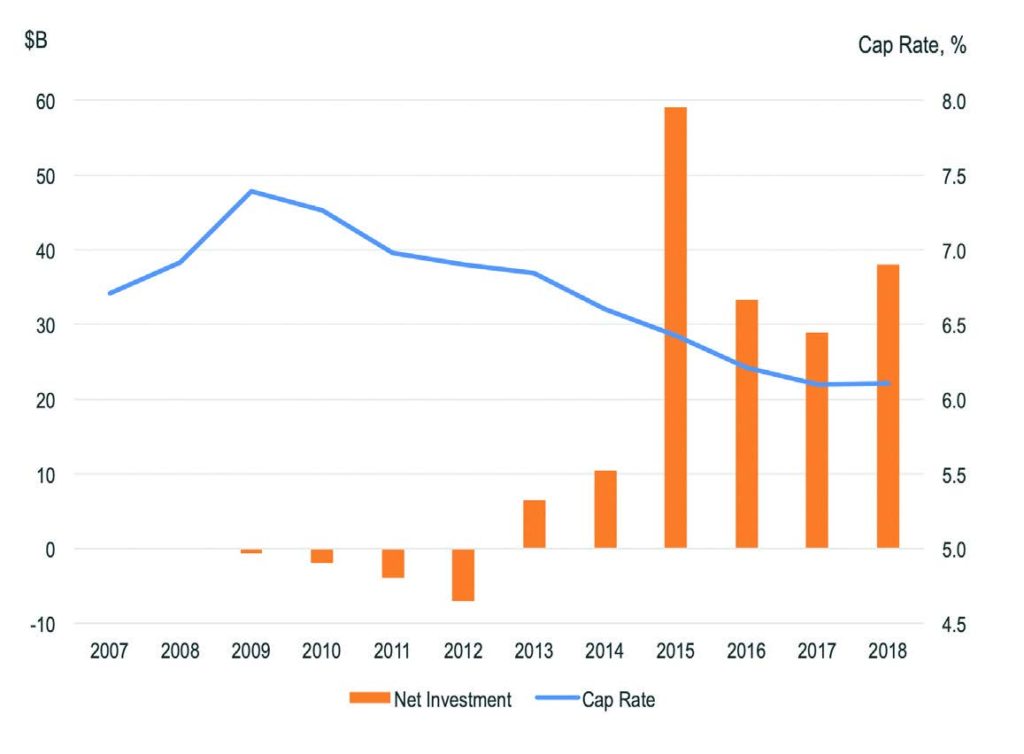
These factors are connected, but again, they are not causally linked with the growth in investment driving cap rates. The impact that cross-border capital has on the market is, at times, difficult to discern as there are so many moving parts to the global system of capital flows. Both are moving as they are due to more structural shifts in risk perceptions.
A challenge the market still faces is a fear that markets overheat when capital moves into one country from another. The fear is that such a move is a sign of a more speculative view of risk much like the move of Japanese investors into the US in the 1980s. Indeed, in this most recent cycle, Chinese investors coming to the US for the first time were often viewed in such a light.
There is a convergence of views on risk through a convergence of views of what real estate should look like as an investment. At the asset level, real estate is a local business, but real estate practice is converging worldwide. The decisions to design, develop, sell, finance and manage such commercial real estate assets worldwide is increasingly a global business.
That appraiser in commenting on experiences over the last 35 years was typically in a second or third tier city of the US. Places like Toledo, Spokane or Tulsa … wonderful low cost business locations and great areas to raise a family. But going back 35 years, the investors and operators which had dominated these markets were typically local investors with private wealth as a capital source. Cross-border investors are generally not investing in such locations but their influence on these markets is being felt with change in how assets are financed, priced and managed in the larger markets.
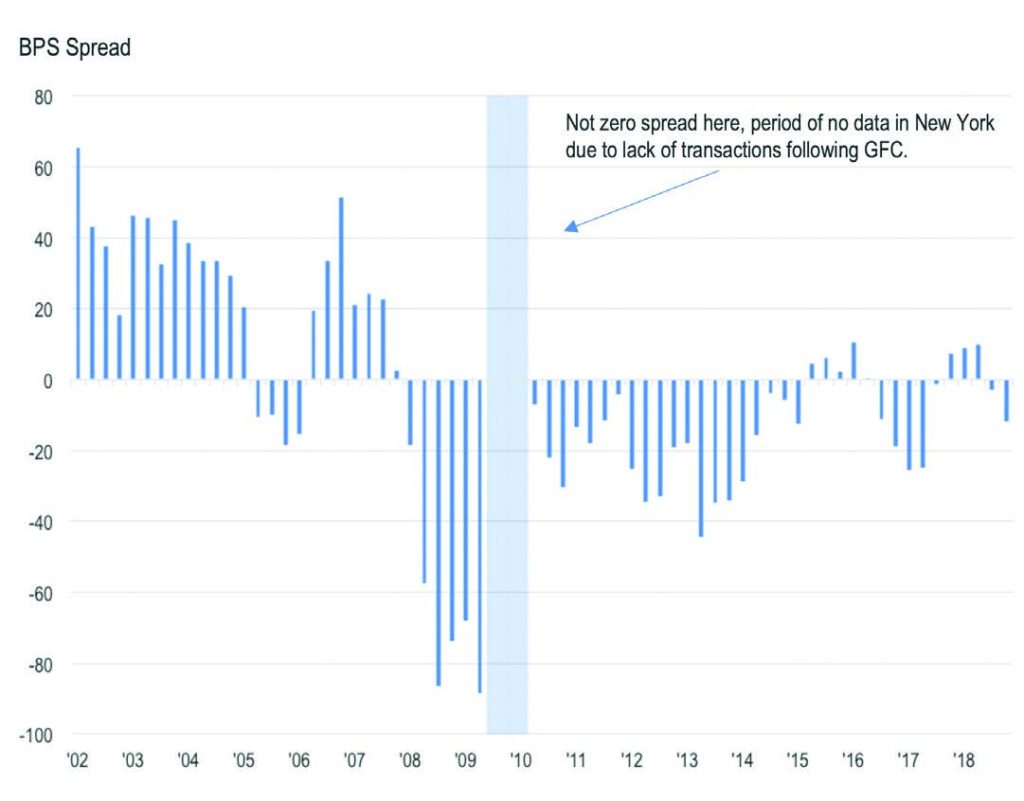
Take Manhattan offices for instance. Go back more than a decade and cap rates were always higher than those in Central London. As shown below, on average cap rates in Manhattan were 27 basis points higher than those for Central London in the five years to December of 2006. Into this most recent economic expansion though this spread narrowed such that Manhattan cap rates were an average 16 basis points lower than those for Central London office in the five years to December of 2016. Some of the lower spread into the current cycle is due to timing differences in the recovery following the Global Financial Crisis which would bring the spread closer to zero.
SPREAD BETWEEN MANHATTAN AND CENTRAL LOND OFFICE CAP RATES NARROWING
Higher average cap rates in Manhattan are converging with global norms as global investors become as comfortable with Manhattan as with other global business hubs. As Manhattan converges, the pricing behavior there is filtering down to smaller markets in the US. Market participants size loans and gauge opportunities off the headline deals presented on the pages of national publications such as the Property Report section of The Wall Street Journal. This behavior helps to push lower cap rates in smaller markets in addition to the structurally lower interest rate environment.
In some respects, the term “cross-border” investor may become increasingly obsolete. Real Capital Analytics goes to great lengths to identify the origin of the capital that fund managers place into investments. That said, classifying extreme cases where, say, a fund manager based in Hong Kong raises equity from Mainland China and the Middle East, and JV’s with a firm based in Texas for a real estate development project in Latin America … can be difficult. Oh, and for fun, imagine that the initial construction financing comes out of Germany with permanent financing from a club deal involving a lot of Japanese insurance companies with some multi-national pool of high-octane capital providing the mezz slice.
Transient shifts in perceptions of risk have led to floods of capital moving from one country to another over time, but recent moves have a different character. That type of scenario where multi-national sources of capital deliver a real estate solution can only exist only because of increasing commonality of real estate practice and information worldwide. The increase in cross-border net investment in the US and compression of US cap rates to low levels were both driven by more structural shifts in risk perception.
—
ABOUT THE AUTHOR
Jim Costello is the Senior Vice President of Real Capital Analytics, a data and analytics firm with offices in New York City, San Jose, and London.