
This article appears in Summit Journal (Fall 2020) | Download PDF
Volatility in commercial real estate varies by metro and sector, and even with the wildcard of COVID-19, understanding what contributed to a market’s volatility in the past is useful for planning in the future.
Investment decisions are predicated on many factors, including insights into which markets are expected to be volatile. Market volatility can represent risk and opportunity and can increase rewards and losses. Volatility can be in an upward or downward direction, but is more commonly in both directions.
Some markets are less volatile because they have strong base economies that offer a floor on how low rents can fall in a recession. Many of the lowest volatility metros have a strong government employment presence and/or have large, established, diverse economies. Other markets are less volatile because they do not attract much investment. In such markets, values and rents do not increase or decrease substantially, and supply and demand do not lurch far out of equilibrium. Those types of markets may represent acceptable environments for debt investments but would not necessarily be a good destination for equity investment.
There are markets that were historically volatile that may exhibit more stable trends going forward. Conversely, the underpinnings of other markets are not substantially different than in the past and will likely be subject to similar gyrations in the future. Although past performance does not guarantee or is indicative of future results, it is most important to identify the source of past volatility to determine the likelihood of repetition.
In this article, we present volatility scores for multifamily, office, and industrial property types by metro area, with a focus on why certain metros scored as they did and, most importantly, the likelihood that the future resemble the past.
THEMES IN LOW-VOLATILITY MARKETS
Our analysis of the volatility of the top 60 markets in the US has revealed several patterns. The list of least volatile markets was mostly filled by metros with government labor concentrations—including federal, state and military—and markets with large, established, diverse economies. Certain
de-industrialized older markets had lower levels of volatility which reflected their economic weakness and their relative stability. (For example, Miami, Ft. Lauderdale, and West Palm Beach were relatively less volatile, particularly in the multifamily sector. This is perhaps a reflection of the stabilizing nature of the strong presence of retirees.)
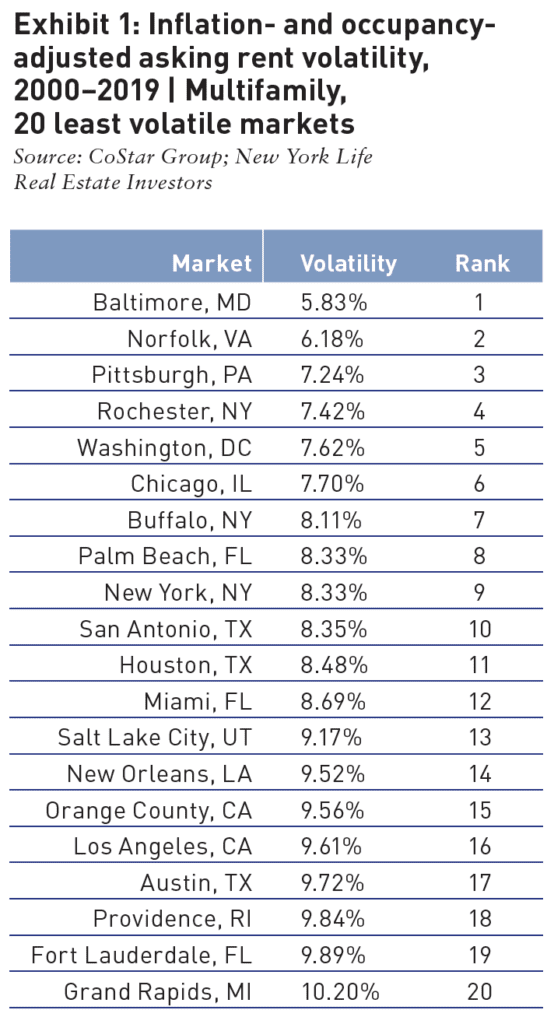
Multifamily markets with government labor concentrations included those that stemmed from the federal, state and military sectors. Generally, government employment is relatively stable through various stages of the economic cycle and forms a floor protecting against radical volatility.
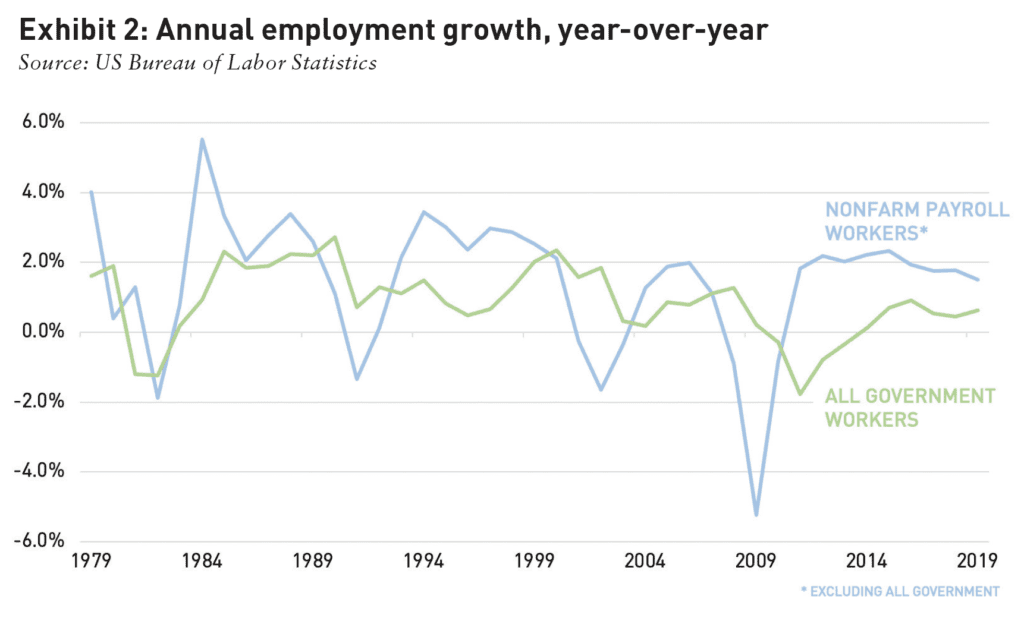
The least volatile markets include Baltimore (1) Norfolk (2), Washington (5), San Antonio (10), Salt Lake City (13), Austin (17), Providence (18), with heavy government concentrations in the federal, state, or military sectors. Baltimore, home to the Social Security Administration, has a federal jobs Location Quotient (LQ) of 1.97 and a state jobs LQ of 1.48. Norfolk, home to Naval Station Norfolk, the world’s largest naval station [1], has a federal jobs LQ of 4.07 and a state jobs LQ of 0.84. Washington, DC, the nation’s capital, has a federal jobs LQ of 5.97. San Antonio, home of Joint Base San Antonio which includes Fort Sam Houston, Lackland Airforce Base and Randolph Airforce Base [2], has a federal jobs LQ of 1.84. Salt Lake City (13), Austin (17), and Providence are state capitals with a significant amount of state employees. Exhibit 2 shows how government employment have been less volatile than private sector employment.

OBSERVATION PERIOD
The observation period of 2010–2019 only reveals the recovery from one cycle and is insufficient to expose long-term trends. The observation period of 1990–2019 covered several cycles but its drawbacks include the lack of coverage for a consequential number of markets. In addition, the further the analysis goes back in time, the more dissimilar the historical economy is to the present. Accordingly, the observation period of 2000–2019 was chosen as being most reflective of past short-term volatility.
METRIC TRACKED
Because expense and CapEx numbers are not available for all the metro areas for all the years of the observation period, we relied on rent and occupancy only. The product of rent multiplied by occupancy was used as the base metric and rent alone was presented as a secondary measure. Both measures exhibited similar patterns.
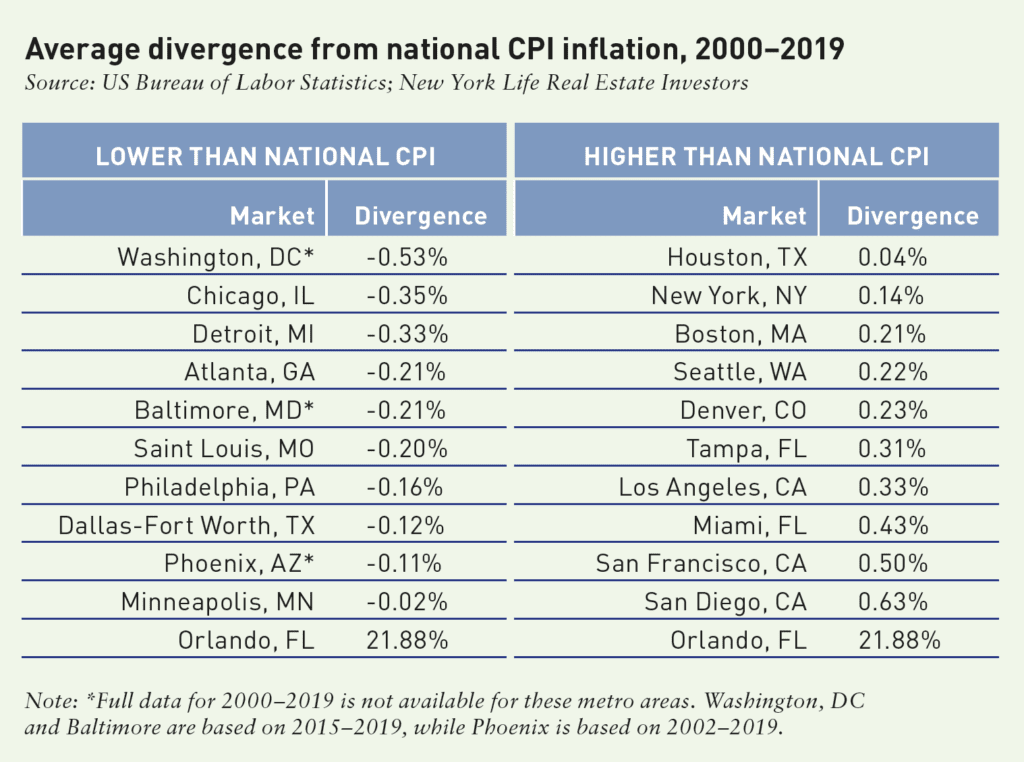
All rent numbers are adjusted for inflation using the national Consumer Price Index (CPI). There are 20 markets with available local CPI numbers, but they were not used, because not all markets are covered. Accordingly, there may be markets in which volatility is overstated or understated based on their divergence from the national CPI number. The 20 known metro-level CPI numbers and their divergence from the national number are detailed below. Volatility in San Francisco and San Diego volatility is likely understated, while volatility in Washington and Chicago is likely overstated. [3]
STANDARD DEVIATIONS
In order to develop a volatility score, we used two standard deviations, because 95% of observations fall within two standard deviations of the mean. The metros are ranked based on the percentage deviation from the mean inflation-adjusted product of rent multiplied by occupancy.
PROPERTY TYPE VOLATILITY
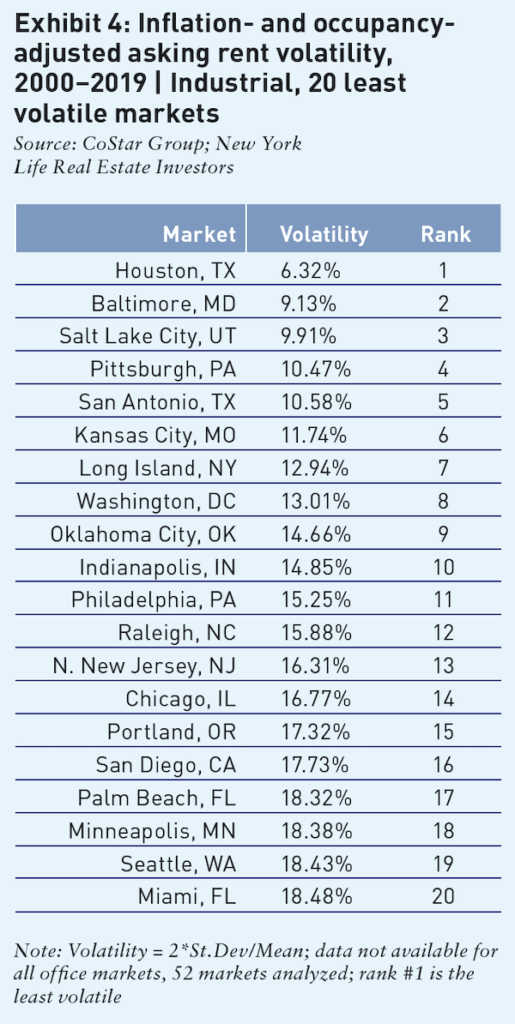
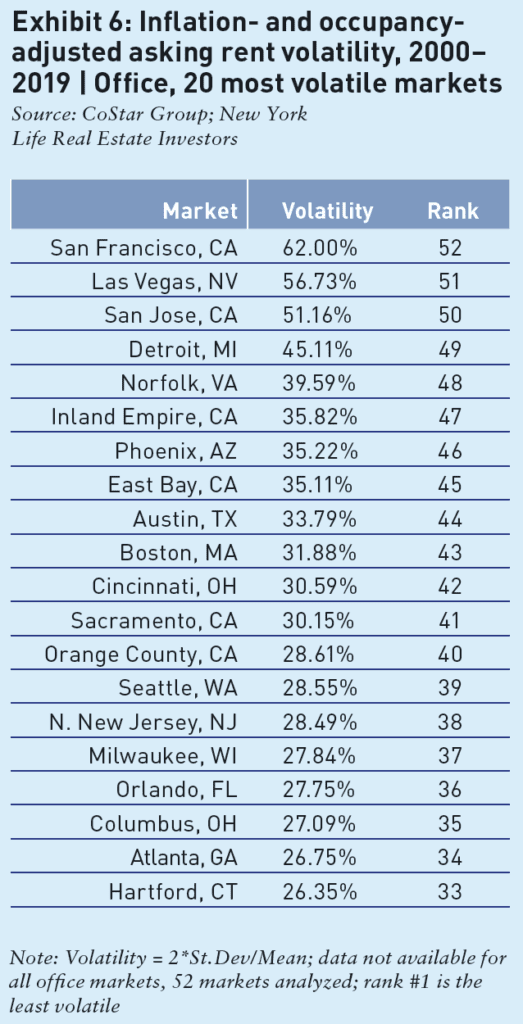
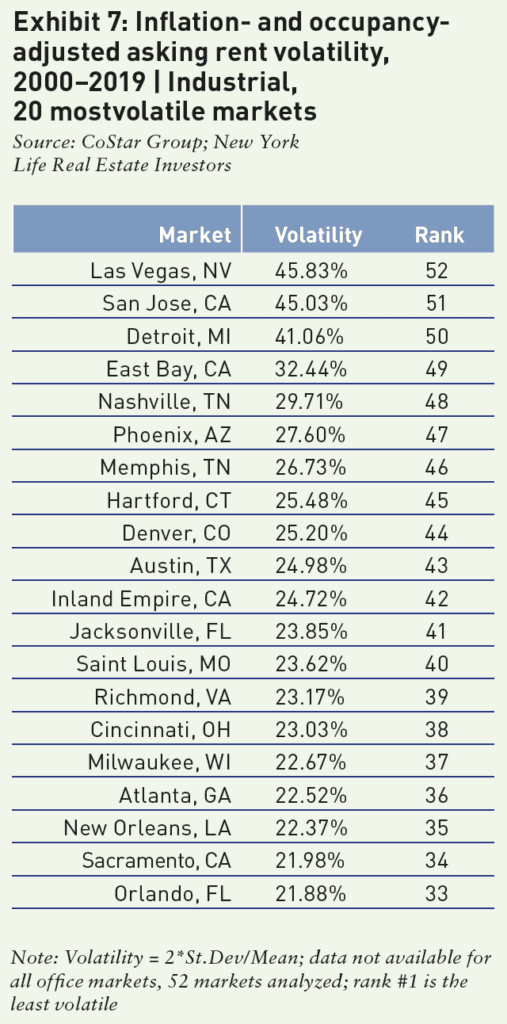
Amongst the three property types that were analyzed, multifamily was the least volatile, with markets ranging from a minimum of a 5.83% volatility (deviation) score to a maximum of 29.78% volatility score. Office proved to be the most volatile with markets ranging from 10.74% to 62%. Industrial markets volatility scores ranged from a minimum of 6.32% score to 45.83% score.
Concerning government employment, there is a 95% historic probability that the annual growth rate will fall within 5.4% and -1.7%. Regarding nonfarm payrolls excluding government employment, there is a 95% historic probability that the annual growth rate will fall within 6.0% and -2.5%. The implication is that public sector employment is less volatile than private sector employment.
Markets that are part of large, established, and diverse economies with legal and/or physical barriers to entry such as Miami, New York City, Los Angeles, northern New Jersey, Orange County, and Chicago have also exhibited stability and are included within the top 20 least volatile markets for multifamily.
Metros with large retiree populations, such as Palm Beach, Ft. Lauderdale, and Miami also tended to be included in the least volatile categories, as they represent income streams less subject to the vagaries of the US economy. This is particularly true of the multifamily sector and for Florida markets that are replenishing their senior base. (This is not to be confused with other markets that are very reliant on retiree private pension income which is being phased out and may become more volatile to the downside in the future. [4])
On the other side of the economic health spectrum, markets that have experienced deindustrialization, slow growth, and demographic challenges, such as Buffalo, Rochester, Pittsburgh, and Providence, also exhibited stability because they lacked extreme ups or downs.
Another interesting observation is that certain metro areas with low regulatory and physical barriers to development, such as Houston and Oklahoma City, are less volatile because they are prevented from overheating so that they are constantly recalibrated.
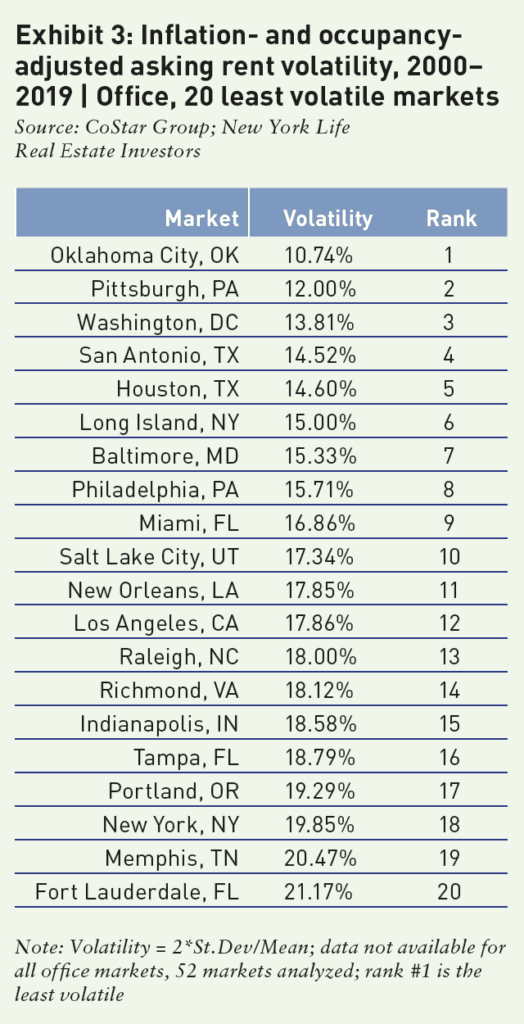
Similar metro themes of government, large diversified economies, and stagnant deindustrialized places are represented in Exhibit 3. Nevertheless, volatility manifests itself somewhat differently in the office building market. For example, newly ascendant Pittsburgh, with its growing artificial intelligence (AI) and tech sectors, combined with its historical steadiness, moves up the stability scale. Meanwhile, Houston has few barriers to entry with no zoning, which also limits its ups and downs as it is constantly recalibrated, and the rents don’t go too high or too low. Similarly, Oklahoma City is one of the largest cities in terms of geographic size and has lower barriers to entry than most metros in the US. Generally, Norfolk’s sailors and soldiers do not work in office buildings. Accordingly, the stability that the military offers for the apartment sector does not necessarily extend to office space.
Certain markets may be poised for more stability mixed with slow but steady growth going forward, as their economies expand and diversify. Some of these metros are gaining a larger concentration of higher paying jobs as their economies diversify. A good example of a metro with this potential is Nashville. Nashville’s college education attainment rate has increased substantially in the past 13 years and has attracted many corporate relocations. Nashville’s college educated population grew from 28.3% in 2005 to 35.9% in 2018. Nashville’s LQ for professional and business services (PBS) jobs has increased from 0.77 in 2000 to 1.00 in 2018. Its leisure and hospitality LQ has declined from 1.10 in 2000 to 1.04 in 2018 while its government LQ has declined from 0.86 to 0.80 during the same time period.
The industrial space is undergoing a transformation to accommodate the needs of e-commerce. Its future performance may be substantially different than it was in the past. Nevertheless, one can discern certain similar themes in the industrial sector. Houston, Baltimore, Salt Lake City, Pittsburgh, San Antonio, Washington, and Oklahoma City are low-volatility metros across all three property types (Exhibit 4).
THEMES IN HIGHER VOLATILITY MARKETS
At the other end of the spectrum, the most volatile markets were generally: markets that were hit hard by the Great Recession and housing crisis, such as Phoenix and Las Vegas; markets that have experienced sustained decreased rents over time, such as Memphis and Detroit; and markets that have a significant tech concentration such as San Francisco, San Jose, and Raleigh.
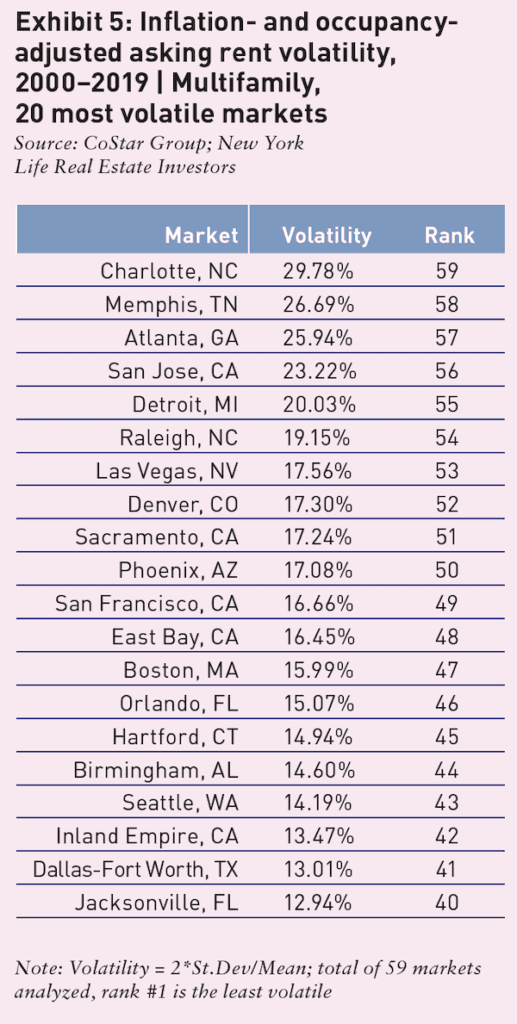
Las Vegas and Phoenix were at the epicenter of the US housing bust and their economies and commercial real estate markets were disproportionally impacted. Atlanta is the “Regional Economic Capital” [5] of the Southeast and host to 18 Fortune 500 companies. Its tech LQ (1.32), PBS LQ (1.22), and financial activities LQ (1.02) reflect a large diversified economy. Nevertheless, it has exhibited a high degree of volatility during past cycles, primarily due to overbuilding. As construction is more restrained in this cycle, we would not expect a recession to hit Atlanta as hard as in the past. Atlanta’s college-educated population grew from 34.3% in 2005 to 39.4% in 2018.
Detroit and Memphis have experienced a long-term decline in inflation-adjusted rent and that is reflected in the volatility charts that feature sharp downward slopes.
San Jose, San Francisco, East Bay, and Raleigh have high volatility rates consistent with their reliance on tech jobs. Previous boom and bust cycles, especially in the aftermath of the dot-com bust of 2000 resulted in violently gyrating rent levels. Tech employment has fundamentally changed since 2000 and is now integrated into many industries and companies that are profitable and are parts of everyday life. In addition, much tech employment is found within companies in nearly every sector including fi nance. The above notwithstanding, tech-focused metros are not immune to downward adjustments in rent levels in the future. There are many tech companies today that have little or no income. Large companies such as WeWork [6], Uber, Lyft, DoorDash, Postmates, and Seated lose millions of dollars each year. Nevertheless, it is hard to imagine a repeat of the 2000 tech bust.
Raleigh’s reliance on tech has actually increased over the past 20 years, rising from 1.81 in 2000 to 2.41 in 2018. However, the nature of that tech concentration is different and more diverse today as tech has infiltrated nearly every industry. Concentrations of office-using employment in Raleigh have increased their presence over the past two decades including PBS (from 1.42 in 2000 to 1.62 in 2018) and biotech (1.69, 2.49). An important manifestation of Raleigh’s evolution is its continued and growing presence amongst the most college educated metros in the US Raleigh’s college educated population grew from 41.7% in 2005 to 48.0% in 2018.
Denver still has a relatively high energy concentration (1.33), but it has diversified over the past 20 years. PBS is now a larger part of the economy rising from 1.44 LQ in 2000 to 1.47 LQ in 2018. The Tech LQ has decreased from 1.74 in 2000 to 1.65 in 2018, but it is a very different type of tech job. While in the past Denver’s tech employment was more telecom-based and frothier, now it is a more stable tech, which is integrated into companies in diverse industries. Denver’s college educated population grew from 36.8% in 2005 to 44.8% in 2018.
The Charlotte economy’s outsized growth is primarily due to the metro’s position as the second largest banking center in the US. (It is host to the headquarters of the world’s largest banks,Wells Fargo and Bank of America. Trust Bank—the result of a merger of SunTrust-BB&T—will be the sixth-largest bank in the US.) Charlotte’s high volatility number is a reflection of the past instability of the banking sector. The finance activities jobs LQ is 1.55—higher than the 1.42 ratio recorded in 2002 and the 1.02 ratio logged in 2000. Nevertheless, Charlotte has become more diverse in other ways as the PBS employment category LQ increased from 0.78 in 2000 to 0.98 in 2019. The tech employment category LQ increased from 0.82 in 2000 to 0.92 in 2018.
More recently, Honeywell, Microsoft, and Lowe’s technology division’s relocation to Charlotte has buttressed its technology industry. Charlotte’s college educated population grew from 30.3% in 2005 to 36.1% in 2018. Charlotte’s more educated populace and more diverse economy may temper the fallout from the next downturn.
Industrial is a property type in transition as changes in the supply chain have shifted some demand from retail properties to warehouse distribution facilities. Nevertheless, some of the same themes and dynamics are present in volatility metrics from market to market. Las Vegas, San Jose, Detroit, East Bay, Phoenix, Memphis, and Hartford take seven of top eight positions.
LOOKING BACK TO LOOK FORWARD
Historic volatility levels vary by metro area and property type. Volatility increases risk, but also increases the possibility of higher returns if an investor enters and exits a market at a propitious time. Low volatility markets may limit substantial gains while providing steady and relatively safe returns. Certain volatile markets have steep downward rent slopes that reveal a precipitous decline and may possess the disadvantages of both high and low volatility markets.
There are certain US metros that have different economies than they had at the beginning of the observation period. As an example, Denver is more diversified and has experienced a significant increase in young college-educated. Similarly, Nashville’s college education attainment rate has increased substantially in the past 13 years and has attracted many corporate relocations. These are examples of markets that may be less volatile going forward.
It is important to interpret past volatility and determine its causes which may be unique in each metro area and even for the various property types in the respective metro areas. Once the causes of volatility and relative stability are considered, the probability of future volatility is determined based on the likelihood that the economic underpinnings of the metro have fundamentally changed or remained largely similar.
—
ABOUT THE AUTHORS
Stewart Rubin is Senior Director and Head of Strategy and Research, and Dakota Firenze is a Senior Associate, for New York Life Real Estate Investors, a division of NYL Investors LLC, a wholly-owned subsidiary of New York Life Insurance Company.
NOTES
1. Naval Station Norfolk supports 75 ships and 134 aircraft alongside 14 piers and 11 aircraft hangars.
2. The 502d Air Base Wing is headquartered at Fort Sam Houston, Texas. The 502d is the home of Joint Base San Antonio, one of 12 joint bases within the Department of Defense (DoD).
3. Full metro-level CPI data for 2000–2019 is not available for Washington, DC, Baltimore, and Phoenix metro areas. Washington, DC and Baltimore are based on 2015–2019, while Phoenix is based on 2002–2019.
4. See Rubin and Firenze, “Remeasuring the Metro: Retirement Income and Transfer Payments Can Be Used to Measure Economic Fragility,” Summit Journal (Fall 2019), afire.org/summit/remeasuring-the-metro/
5. See Rubin and Firenze, “Regional Economic Capitals and the Big Six”, Institutional Real Estate Americas, January 2019. newyorklife.com/assets/docs/pdfs/rei/Regional-economic-capitals-and-big-six-abridged.pdf
6. Many believe that WeWork is not actually a tech company, but its self-identification as well as VC funding reflects that category.
DISCLAIMER
NYL Investors LLC: The information presented has been prepared by Real Estate Investors for informational purposes only and sets forth our views as of this date. The underlying assumptions and our views are subject to change. This does not constitute investment advice and should not be used as a basis for any investment decision. There is no guarantee that market expectation will be achieved.
The comments, opinions, and estimates contained herein are based on and/or derived from publicly available information from sources that Real Estate Investors believes to be reliable. We do not guarantee the accuracy of such sources or information.
No part of this material may be i) copied, photocopied, or duplicated in any form, by any means, or ii) redistributed without Real Estate Investors prior consent. Real Estate Investors is an investment group within NYL Investors LLC. NYL Investors LLC (“NYL Investors”) is a direct whollyowned subsidiary of New York Life Insurance Company. NYL Investors is comprised of the following investment groups: (i) Fixed Income Investors, (ii) Private Capital Investors and (iii) Real Estate Investors.
CoStar Realty Information, Inc.: The forwardlooking information prepared by CoStar Realty Information, Inc. (“Licensor”) and presented herein is based on information from public and proprietary sources, as well as various assumptions concerning future events that are uncertain and subject to change without notice. Actual results and events may differ materially from those expressed or implied by the Licensor data presented. All Licensor data contained herein speaks only as of the date referenced, may have materially changed since such date, and is provided “as is” with no guarantee or warranty of any kind. Licensor has no obligation to update any of the Licensor data contained herein. None of the Licensor data contained herein should be construed as investment, tax, accounting or legal advice.
—