
Flooding has been a major threat to life and property since before and especially after the advent of agrarian societies—and even more so with the rise of cities.
A flood in ancient Mesopotamia was part of the plot in one of the oldest pieces of literature. In the “The Epic of Gilgamesh,” Uta-Naphisti and his family are saved from a flood that engulfs their world. The impact is so dire that the other vexations of humankind are considered preferable to the damage wrought by water. The author puts the following into the mouth of one of the protagonists: [1]
Would that a lion had ravaged mankind — Rather than the Flood, Would that a wolf had ravaged mankind—Rather than the Flood, Would that had famine wasted the world— Rather than the Flood, Would that pestilence had wasted mankind—Rather than the Flood.
Extreme weather and climate change resulting in flood damage can change the trajectory of the demographic and economic success of cities. As the US enters the third decade of the twenty-first century, flood damage caused by environmental factors has begun to take on greater importance.
This article will cite several examples of historical changes engendered by flood damage and then explore which US cities are most exposed to this risk and how that risk may magnify over the next twenty years.
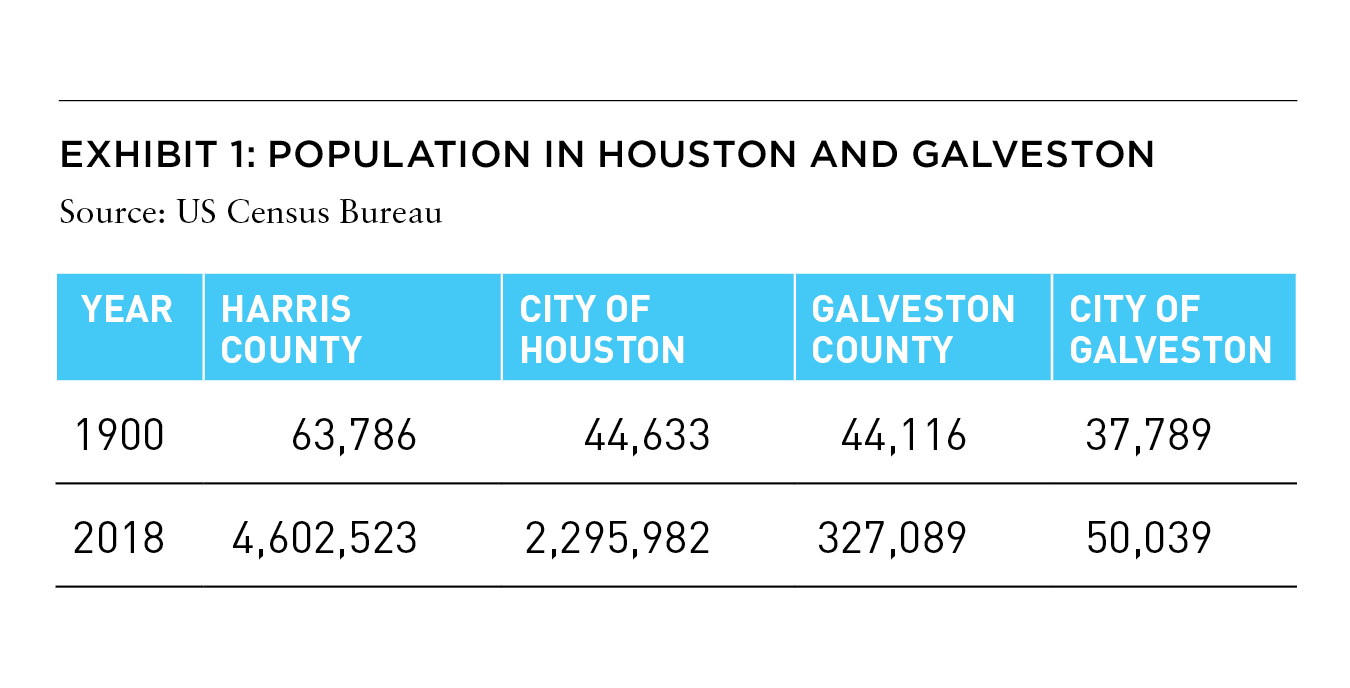
As the twentieth century dawned, it was not clear if Galveston or Houston would be the premier city of the Texas coast. At the turn of the previous century, one would not have been thought unreasonable if one predicted that the winner would be Galveston. Galveston had among the highest per capita income levels in the US.[2] In 1899, it was the third largest port in the US (measured by use) and was served by forty-five steamship lines. The city benefitted from its natural harbor and was the major center for trade in Texas and it hosted sixteen consulates. The city itself grew by 30% in the previous decade and as of 1900, the city of Galveston had 38,000 while the city of Houston had 45,000 people. However, as of 2018, the city of Galveston had 50,000 people while the city of Houston had 2.3 million people.
What caused the astonishing difference in growth trajectories? In 1900, the Great Galveston Hurricane effectively destroyed the city of Galveston. The hurricane resulted in approximately 8,000 fatalities and left approximately 10,000 people homeless. Approximately 7,000 buildings in Galveston were destroyed, including 3,636 homes. The catastrophe ended the Texas coast competition for primacy, as shocked potential investors pivoted to Houston. Climate impacts economic history, and Houston became the economic engine for southeast Texas.[3]
RECENT WATER CATASTROPHES
Hurricane Katrina caused more than 1,800 deaths and $125 billion in damage in August 2005, principally in the New Orleans area.
In 2005, the city of New Orleans represented by Orleans Parish had a population of 494,294. In 2006, in the aftermath of Katrina, the population declined 53.4% to 230,172. As of 2019, the population stands at 390,144—still 21% lower than it was pre-Katrina. A similar trend is evident in the Greater New Orleans metro area, with the 2019 population still 9% lower than its 2005 level.[4]
In October 2012, Hurricane Sandy inflicted approximately $65 billion in damage on the northern Atlantic coast.[5] New York and New Jersey were particularly impacted when storm surge hit New York City, flooding streets, tunnels, and subway lines, and cutting power. Large sections of Lower Manhattan, including Battery Park, were flooded when the East River overflowed its banks. Homes, buildings, roadways, boardwalks, and mass transit facilities in low-lying coastal areas of the outer boroughs of Queens, Brooklyn, and Staten Island were flooded by Atlantic Ocean surges. There were 53 Sandy-related deaths in the state of New York.[6] Approximately 100,000 residences on Long Island were destroyed or severely damaged, including 2,000 that were rendered uninhabitable.[7] Despite the heavy damage, New York’s population was far more resilient than New Orleans in the wake of Katrina. New York City’s population remained virtually unchanged between 2012 and 2019. The population of hard-hit Manhattan, Staten Island, and Nassau County actually increased 0.6%, 1.2%, and 0.6%, respectively, during the same time period.[8] The impact on New York was not permanent. New York continues to be a dominant US city.
In 2017, Hurricane Harvey caused catastrophic flooding resulting in $125 billion damage, primarily from rainfall-triggered flooding in the Houston metro area.[9] In a four-day period, many areas received more than 40 inches of rain, and the subsequent deluge inundated thousands of homes, which displaced more than 30,000 people and caused 106 deaths.[10] Despite this, the population of Houston and Harris County grew 0.2% and 0.8% between 2017 and 2019.[11]
Climate-induced catastrophes do not have the same lasting effect on all places, but they all have potential impact. There are many considerations that factor into the long-term prospects of water damage, including the number and importance of structures destroyed, economic and fiscal strength, and potential for recurrence. Weather-related water damage changed the fortunes of Galveston and left a negative impact on New Orleans—even 15 years after the event. Climate-induced flooding may negatively impact CRE in certain major metro areas and may even permanently alter their host city’s economic future.
According to a recent report by the Urban Land Institute/ Heitman Institutional Realty Partners,[12] developers and investors are increasingly considering water damage potential in their capital deployment strategies. Included in their analysis is assessing how prepared local jurisdictions are to mitigate and react to catastrophic events. Many investors are seeking markets where “governments have the authority, function, and funding to address climate risk, whether at the municipal-government level or through supportive national policies and practices.”[13]
ALSO IN SUMMIT (SPRING 2021)
GREAT LAKES / Tightening the Belts: How are shorthand labels like the “Sun Belt” and the “Rust Belt” shaping investment decisions? Should they?
AFIRE | Gunnar Branson and Benjamin van Loon
SOCIAL ISSUES / The Great Real Estate Reset: A data-driven initiative to remake how and what we build.
Brookings | Christopher Coes, Jennifer S. Vey, and Tracy Hadden Loh
SOCIAL ISSUES / Confronting the Myth: The events of the past year have driven businesses to confront racial inequity, but some still shy away from the challenges needed to make real progress.
Alfred Dewitt Ard Consulting | Shumeca Pickett
INDUSTRY OUTLOOK / CRE Prospects Post-COVID-19: How is commercial real estate set to perform in the post-COVID world?
Aegon Asset Management | Martha Peyton
HOSPITALITY / Time to Check In: If history is a guide, the time to invest in hotels is when things look bleak. This appears to be one of those times.
Barings Real Estate | Jim O’Shaughnessy
HOSPITALITY / Hoteling 2.0: The pandemic has impacted the hospitality, but a growing wave of non-traditional investors has shown heightened interest in the evolving industry.
JLL Hotels & Hospitality Group | Gilda Perez-Alvarado
RESIDENTIAL / Safe as Houses?: The future of residential investments is all about demographics—and the forces behind them.
American Realty Advisors | Sabrina Unger
RESIDENTIAL / Housing for Goldilocks : The pandemic highlights the advantages of single-family and appears to have accelerated migration to less dense, more affordable areas.
GTIS | Eliot Heher and Robert Sun
DATA CENTERS / Data Centers, Stage Center: Data center investments have proven resilient in periods of volatility—and they’re only going to become more essential and important into the future.
Principal Real Estate Investors | Bob Wobschall
CLIMATE CHANGE (WHITE PAPER) / Rather Than the Flood: A comprehensive look at climate-induced water disasters and their potential impact on CRE in the US.
New York Life Real Estate Investors | Stewart Rubin and Dakota Firenze
LOGISTICS / Reforging the Supply Chain: The only way to deliver on the service promises of a booming logistics sector requires a complete reimagination of the supply chain.
Stockbridge | David Egan
DEBT AND LEVERAGE / Leveraging Control: Though leverage is an important part of capital funding, it’s important to ask LPs if (and how) they should take control of their real estate leverage.
RCLCO Fund Advisors | William Maher and Ben Maslan
DEVELOPMENT / Recasting Risk and Return: The investment community can have an active role in economic recovery—but it will require recasting the traditional risk/return framework.
Standard REI | Shubrhra Jha
CORPORATE TRANSPARENCY ACT / Transparency Rules: Non-US-based investors face the disclosure regime of the Corporate Transparency Act. What do you need to know?
Pillsbury | Andrew Weiner
PENSIONS (WHITE PAPER) / Rising Pressures: The latest joint, in-depth report from Praedium and SitusAMC looks at rising fiscal pressures on state and local governments.
Praedium Group and SitusAMC Insights | Russell Appel, Peter Muoio, and Cory Loviglio | SitusAMC Insights
TALENT AND HR / Plugging the Skills Gap: Several trends are forcing change in the global commercial real estate industry, driving demand for new skills. How is the industry responding?
Sheffield Haworth | Max Shepherd
ESG / Operationalizing the Sustainability Agenda: During a time of unprecedented disruption, how should businesses approach the “new metrics” ESG of performance?
AccountAbility | Sunil A. Misser
THE NEGATIVE IMPACT OF FLOODING
The gradual increase in sea levels can adversely impact demand for CRE in coastal areas. Flooding negatively impacts CRE values in obvious and not so apparent ways. It impacts the size of the universe of potential investors. Certain investors have stated that they will not invest in parts of New York, Florida, and other locations for fear of climate-related risk. In addition to rent and occupancy being lower in buildings exposed to flooding, expenses such as insurance, repair and maintenance, and capital reserves are higher. Businesses may suffer losses resulting from property downtime and business disruption.
Insurance increases are noticeable over the past three years. In many markets, commercial insurance rose as high as 10% to 20% between 2019 and 2020, though many insurance companies believe premiums must rise higher to cover costs. Numerous owners and lenders are expecting further increases of the same magnitude or higher for 2020 and 2021. Many insurance companies do not offer or are limiting coverage in high-loss areas. Some major insurers are exiting certain markets.[14] This will certainly result in upward pricing pressure. The insurability of certain markets over the long-term may be called in to question. Insurance rates and market exits may be an additional measure of the relative risk and exposure of certain markets to climate risk.
The negative implications of high exposure to flooding, hurricanes, and tornados is not limited to the destruction of the building itself. Even if the building is free of risk (built high and structurally strong and redundant), the area may become flooded and the asset inaccessible. Should the asset remain accessible—the area will not be desirable, because businesses, retail stores, restaurants, and bars are situated on flooded streets or destroyed. They will not have the benefit of networking with other businesses in the area. Therefore, it is important to widen the focus beyond building resiliency to the infrastructure of the district, the city and even the metro area in which the property exists.
Particularly vulnerable property types include luxury apartments, hotels, and associated retail. Luxury apartment towers are frequently situated near the ocean for views. Hotels and accompanying retail are frequently placed near beaches. Higher sea levels and storm activity can pose a risk for short-term disruption as well as long-term value diminution.
Macro costs may include higher taxes to pay for flood remediation efforts such as sea walls, levees, and pumping systems. Negative impacts may include lower economic activity, declining values, and less investment. Entire districts may become low investment zones. Lower municipal bond ratings, and as consequence, higher borrowing costs, may ensue.
MOST- AND LEAST-EXPOSED METROS
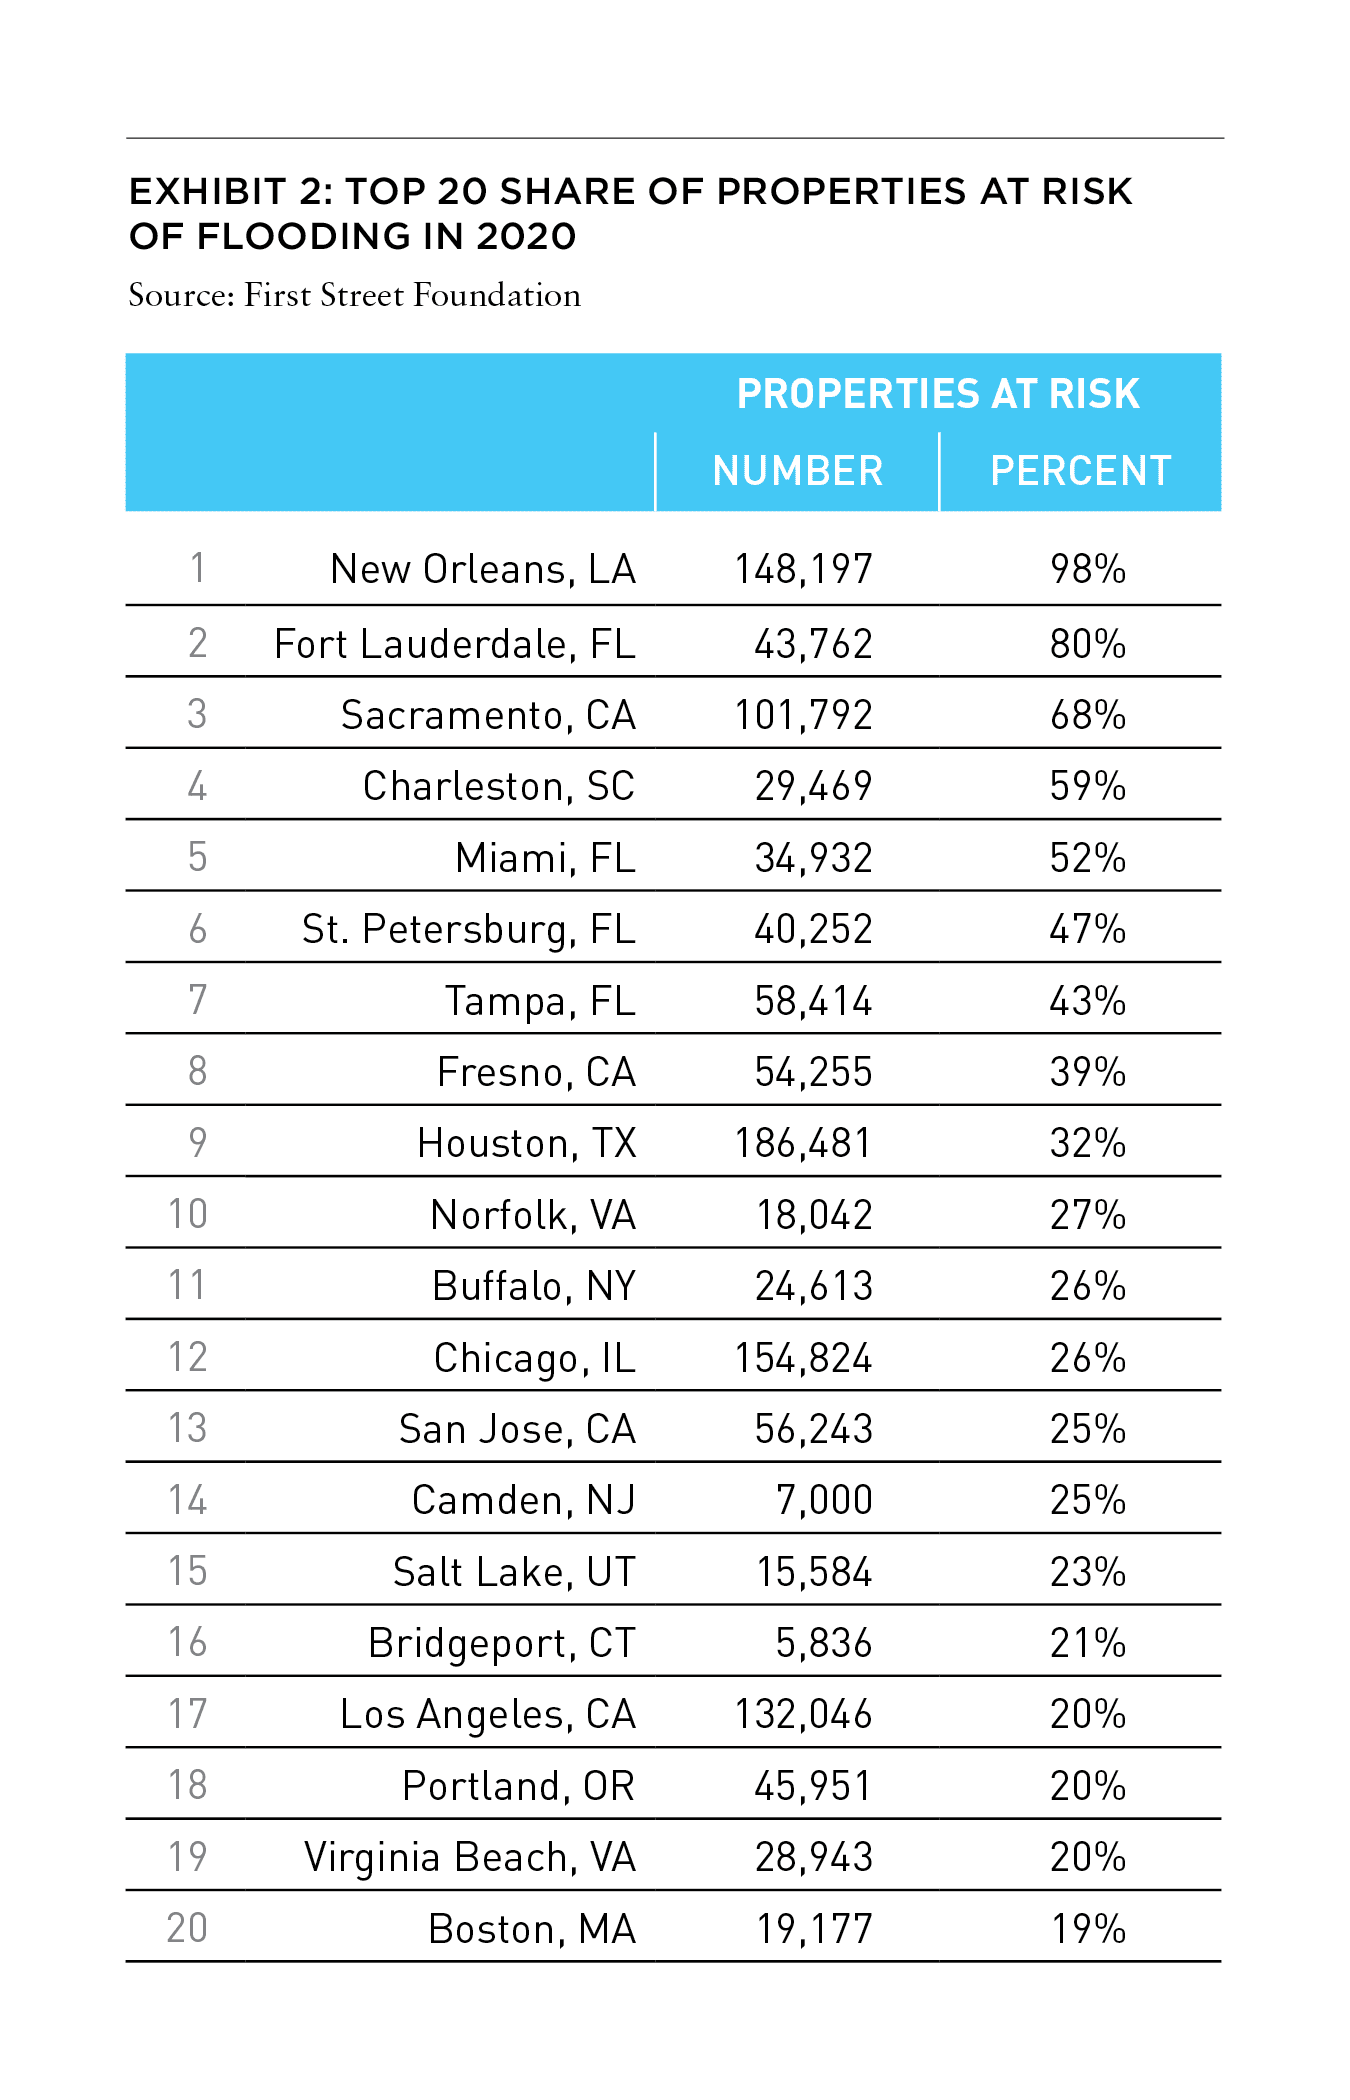
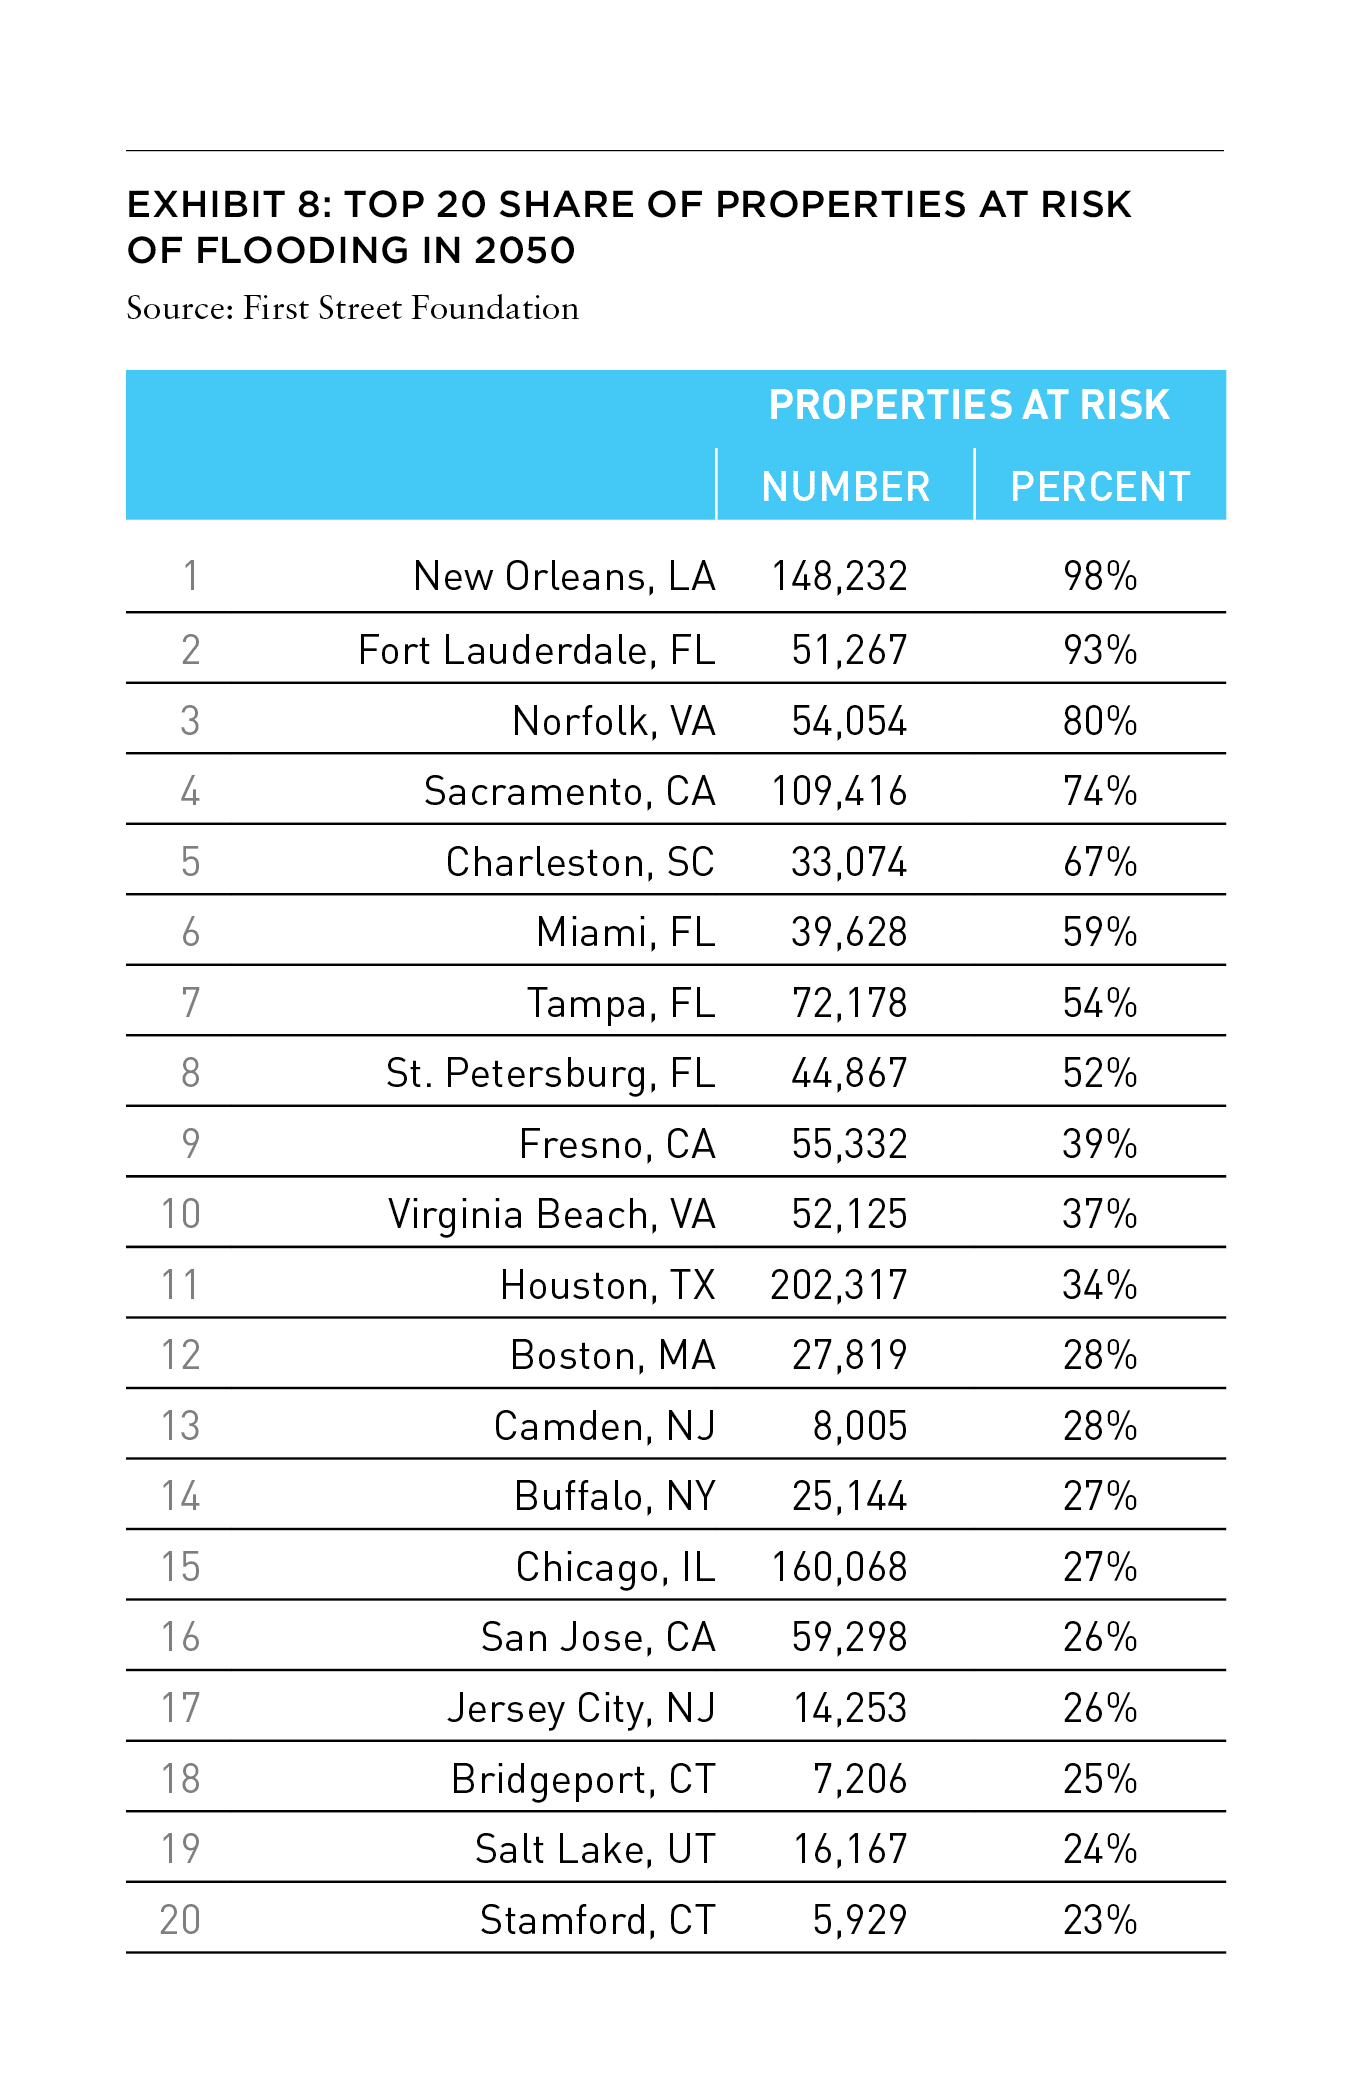
In order to gauge potential current and future damage to American metros, we utilized the First Street Foundation Flood Factor data.[15] Many coastal cities, with their business districts close to sea level, are exposed. This is to be expected, because the economic vibrancy of many of these urban areas was predicated on having a deep-water port which facilitated the flow of immigrants, finished goods, and raw material. Not surprisingly, New Orleans was the most exposed to potential flooding risk in 2020 with almost all (98%) of its of its properties at risk. As Exhibit 2 shows, The Florida cities of Ft. Lauderdale, Miami, St. Petersburg, and Tampa take four out of the next six risk positions. Sacramento, Charleston, Fresno, Houston, and Norfolk round out the balance of the top ten. (It is important to note that coastal flooding does not account for all the water damage risk. Fluvial, pluvial, storm surge, and tidal effects are sources of hazard that propel Sacramento and Fresno into the top ten.)
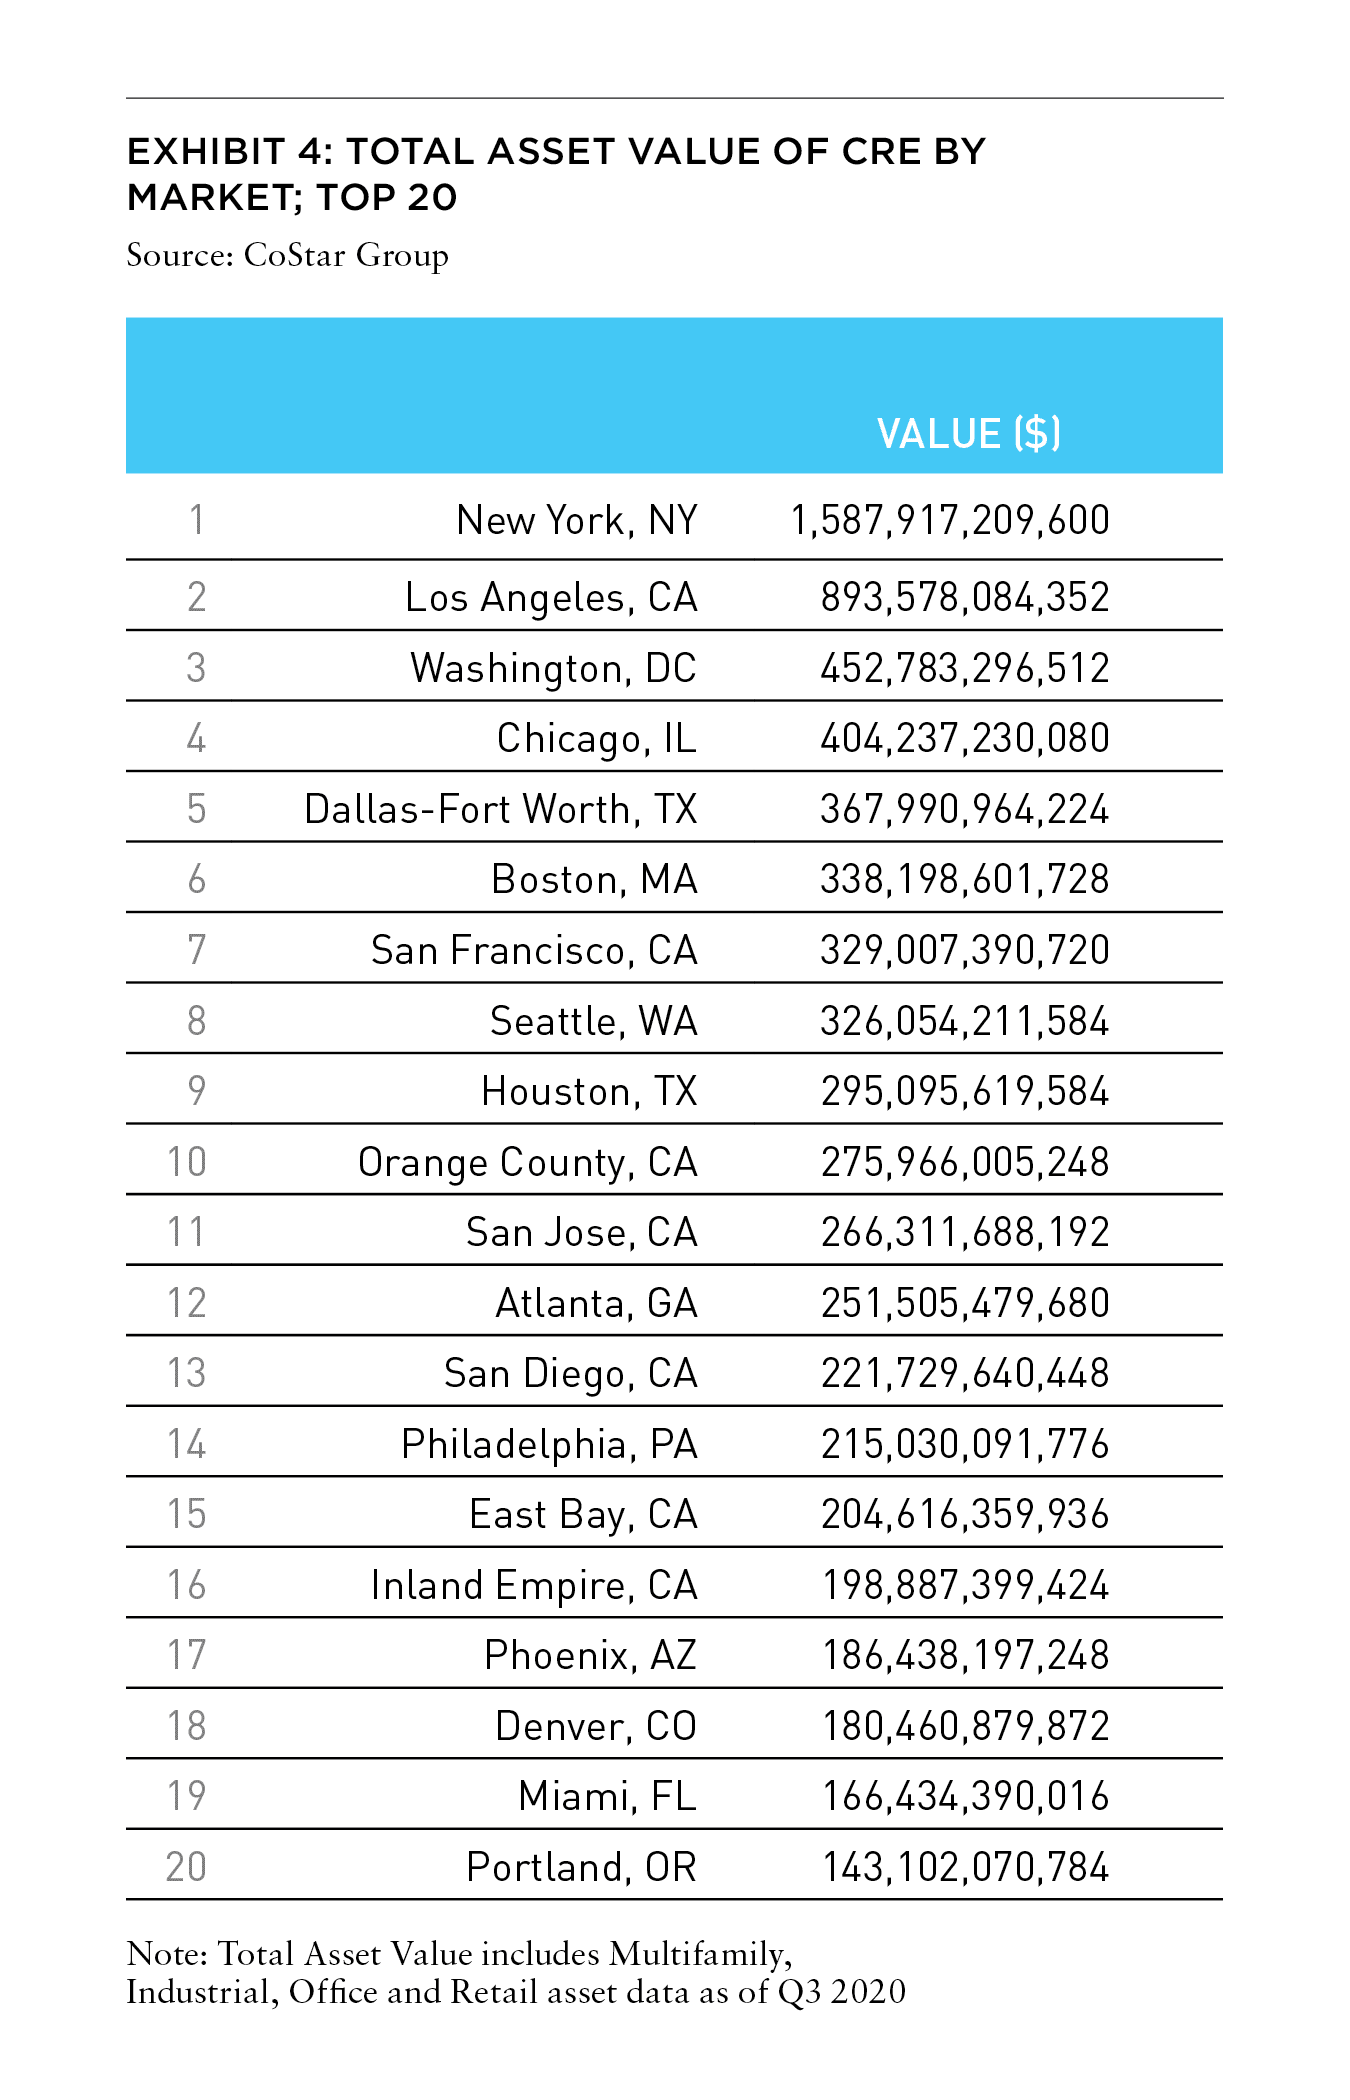
When the high value of CRE in these expensive cities is taken in to account the cost of their elevated exposure becomes even more apparent. The adjacent exhibits emphasize that point.
Large portions of CRE value are situated in areas at high risk of being impacted by coastal flooding resulting from a rise in sea-level. Exhibit 4 details metro areas ranked by the value of their aggregate CRE.
The geographies most exposed are situated on the Gulf Coast, Atlantic Coast, Pacific Coast, around the Great Lakes, the Great Salt Lake, and certain low-lying and river-adjacent areas. Cities with high CRE value, including New York, Los Angeles, Chicago, Boston, Houston, San Jose, and Miami are among the most exposed to water damage. In many of these urban conurbations, a substantial portion of CRE is in CBDs and/or located close to bodies of water.
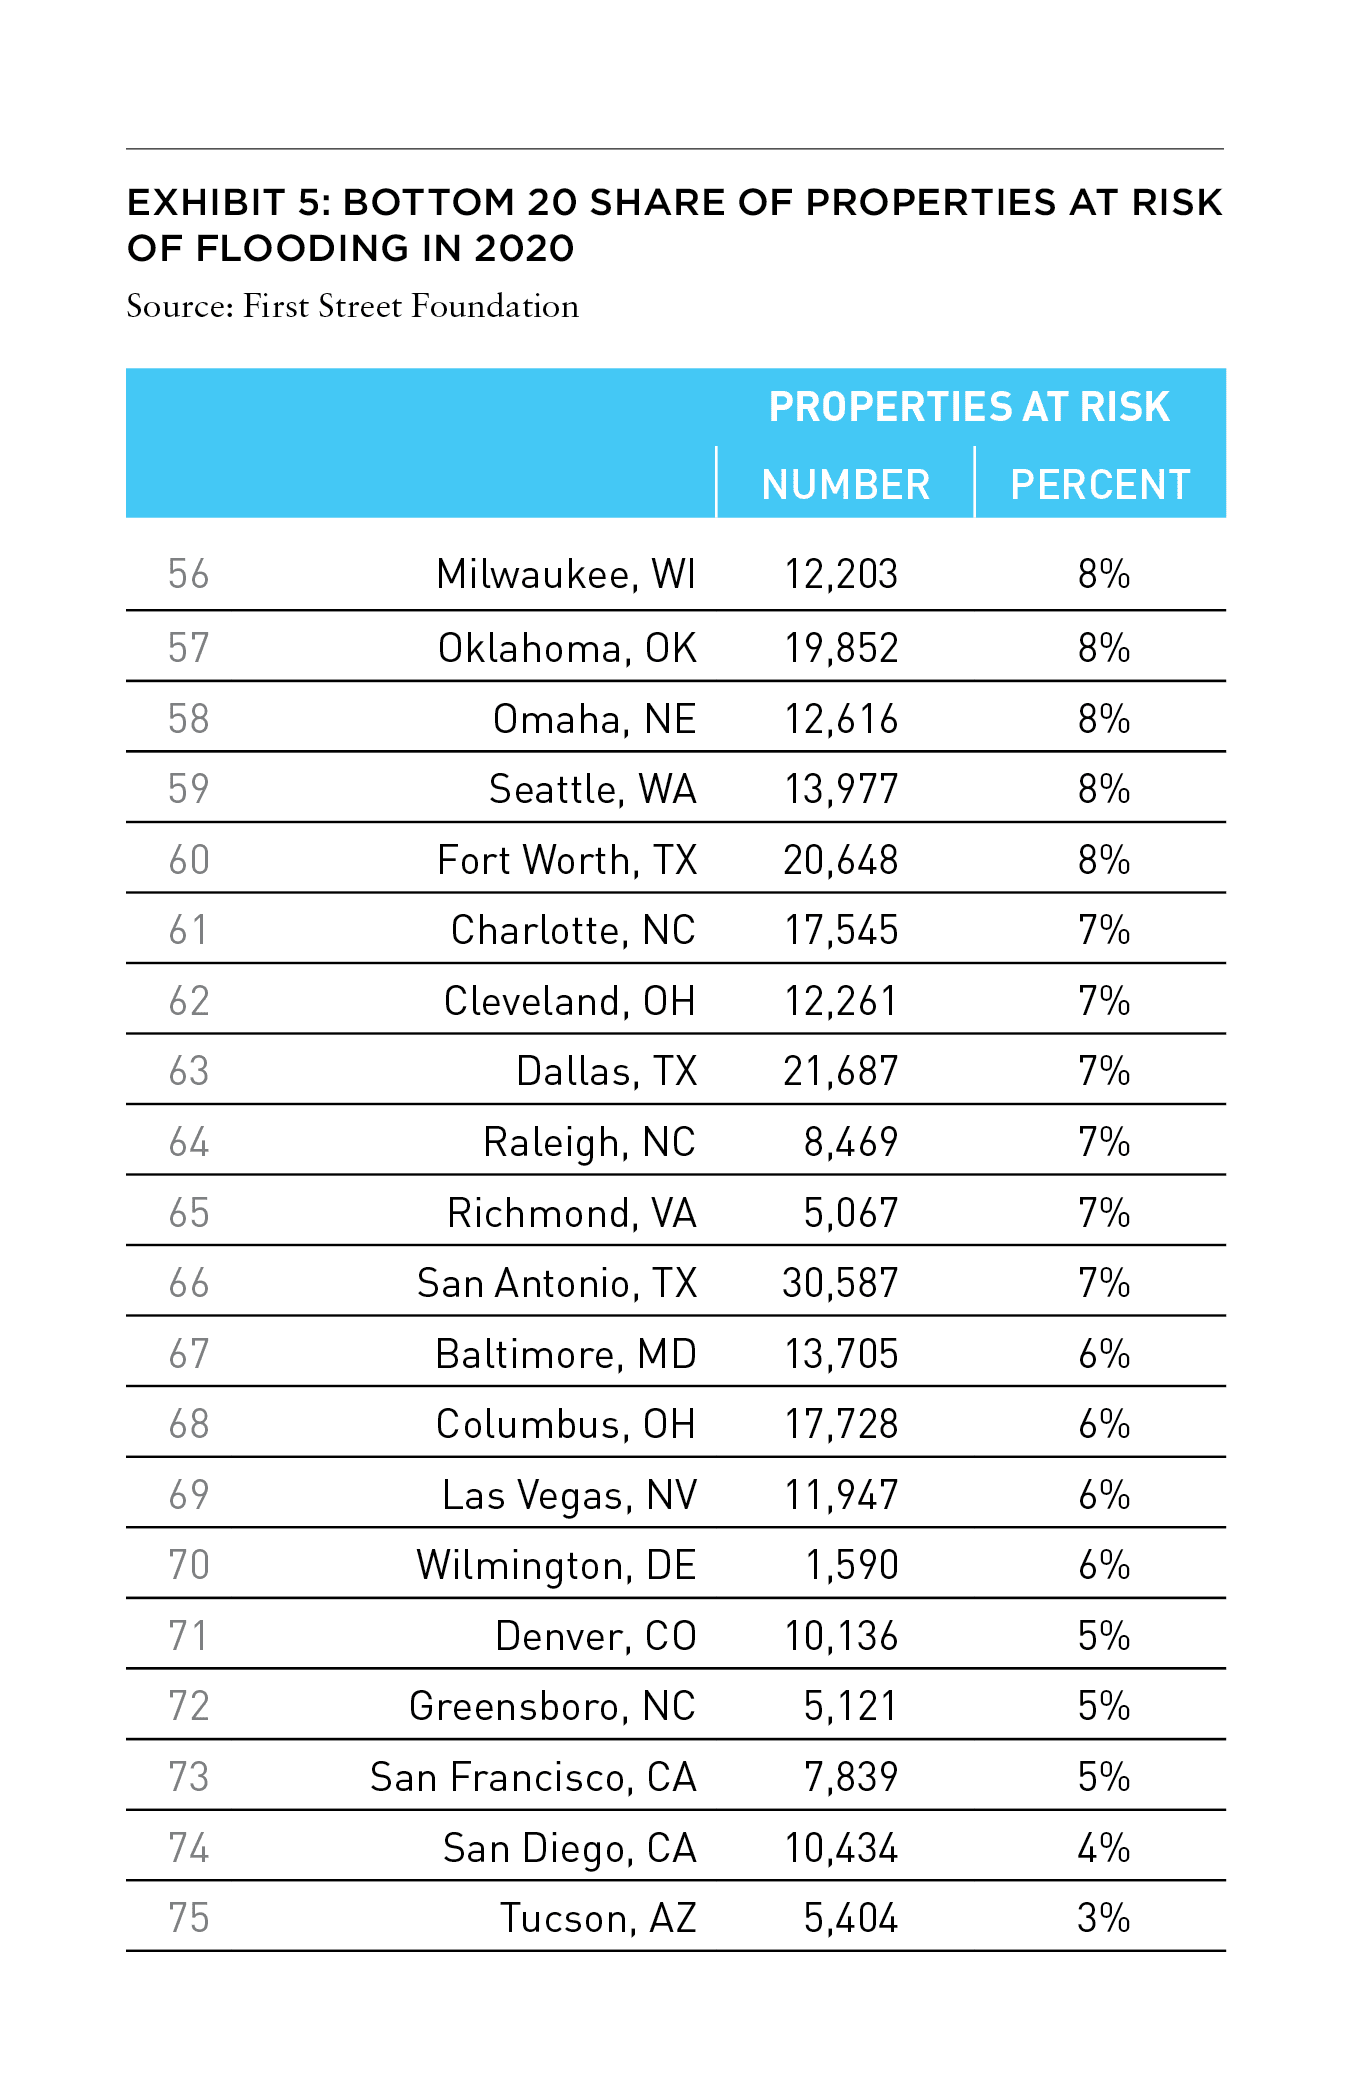
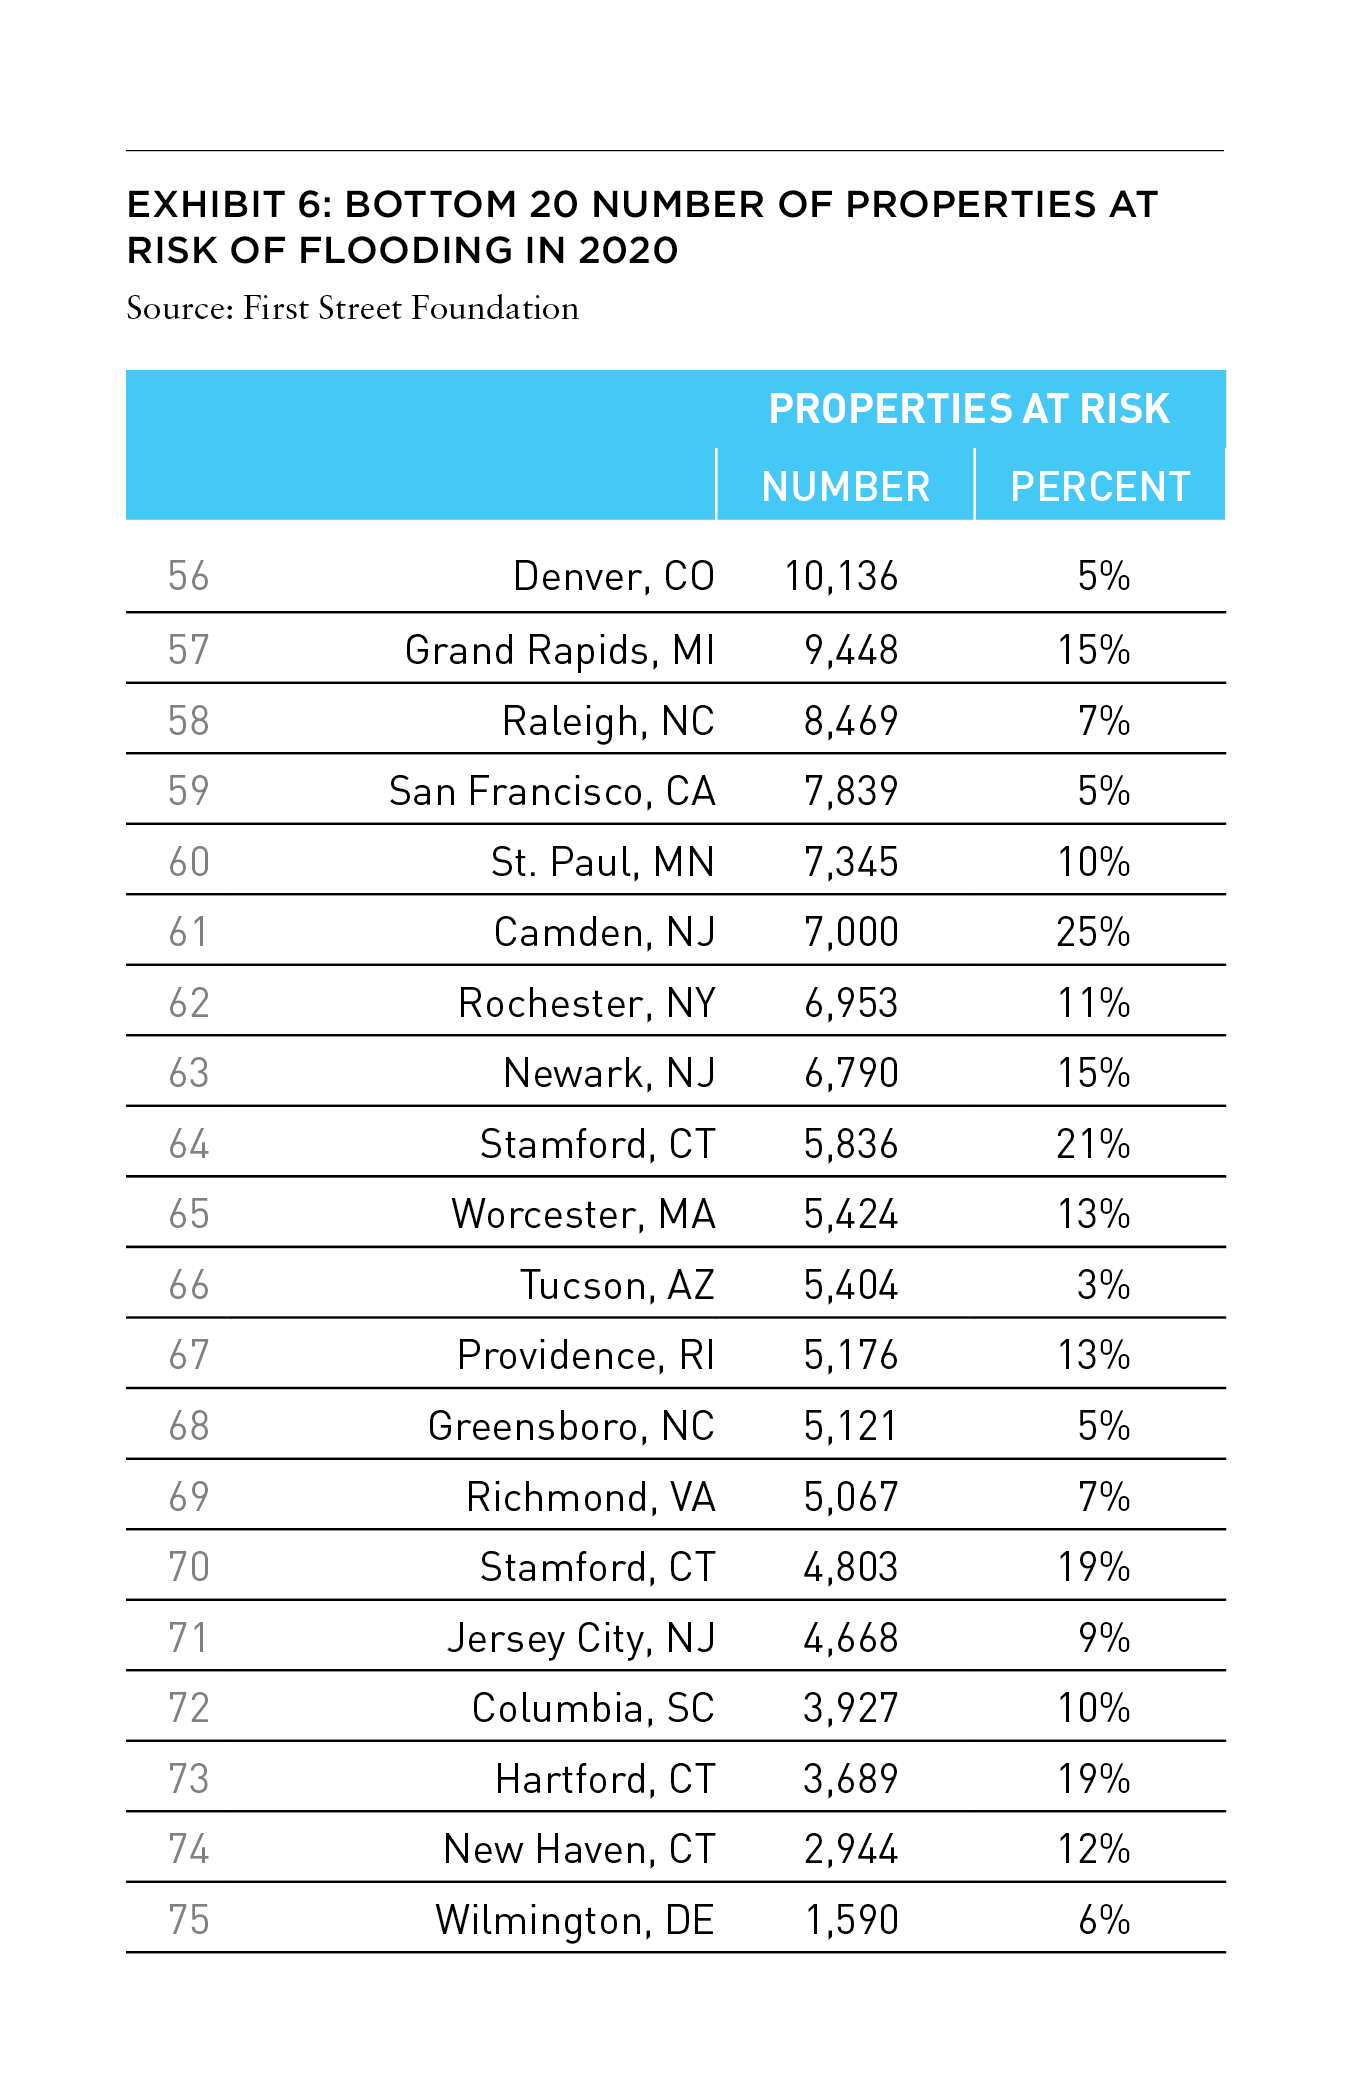
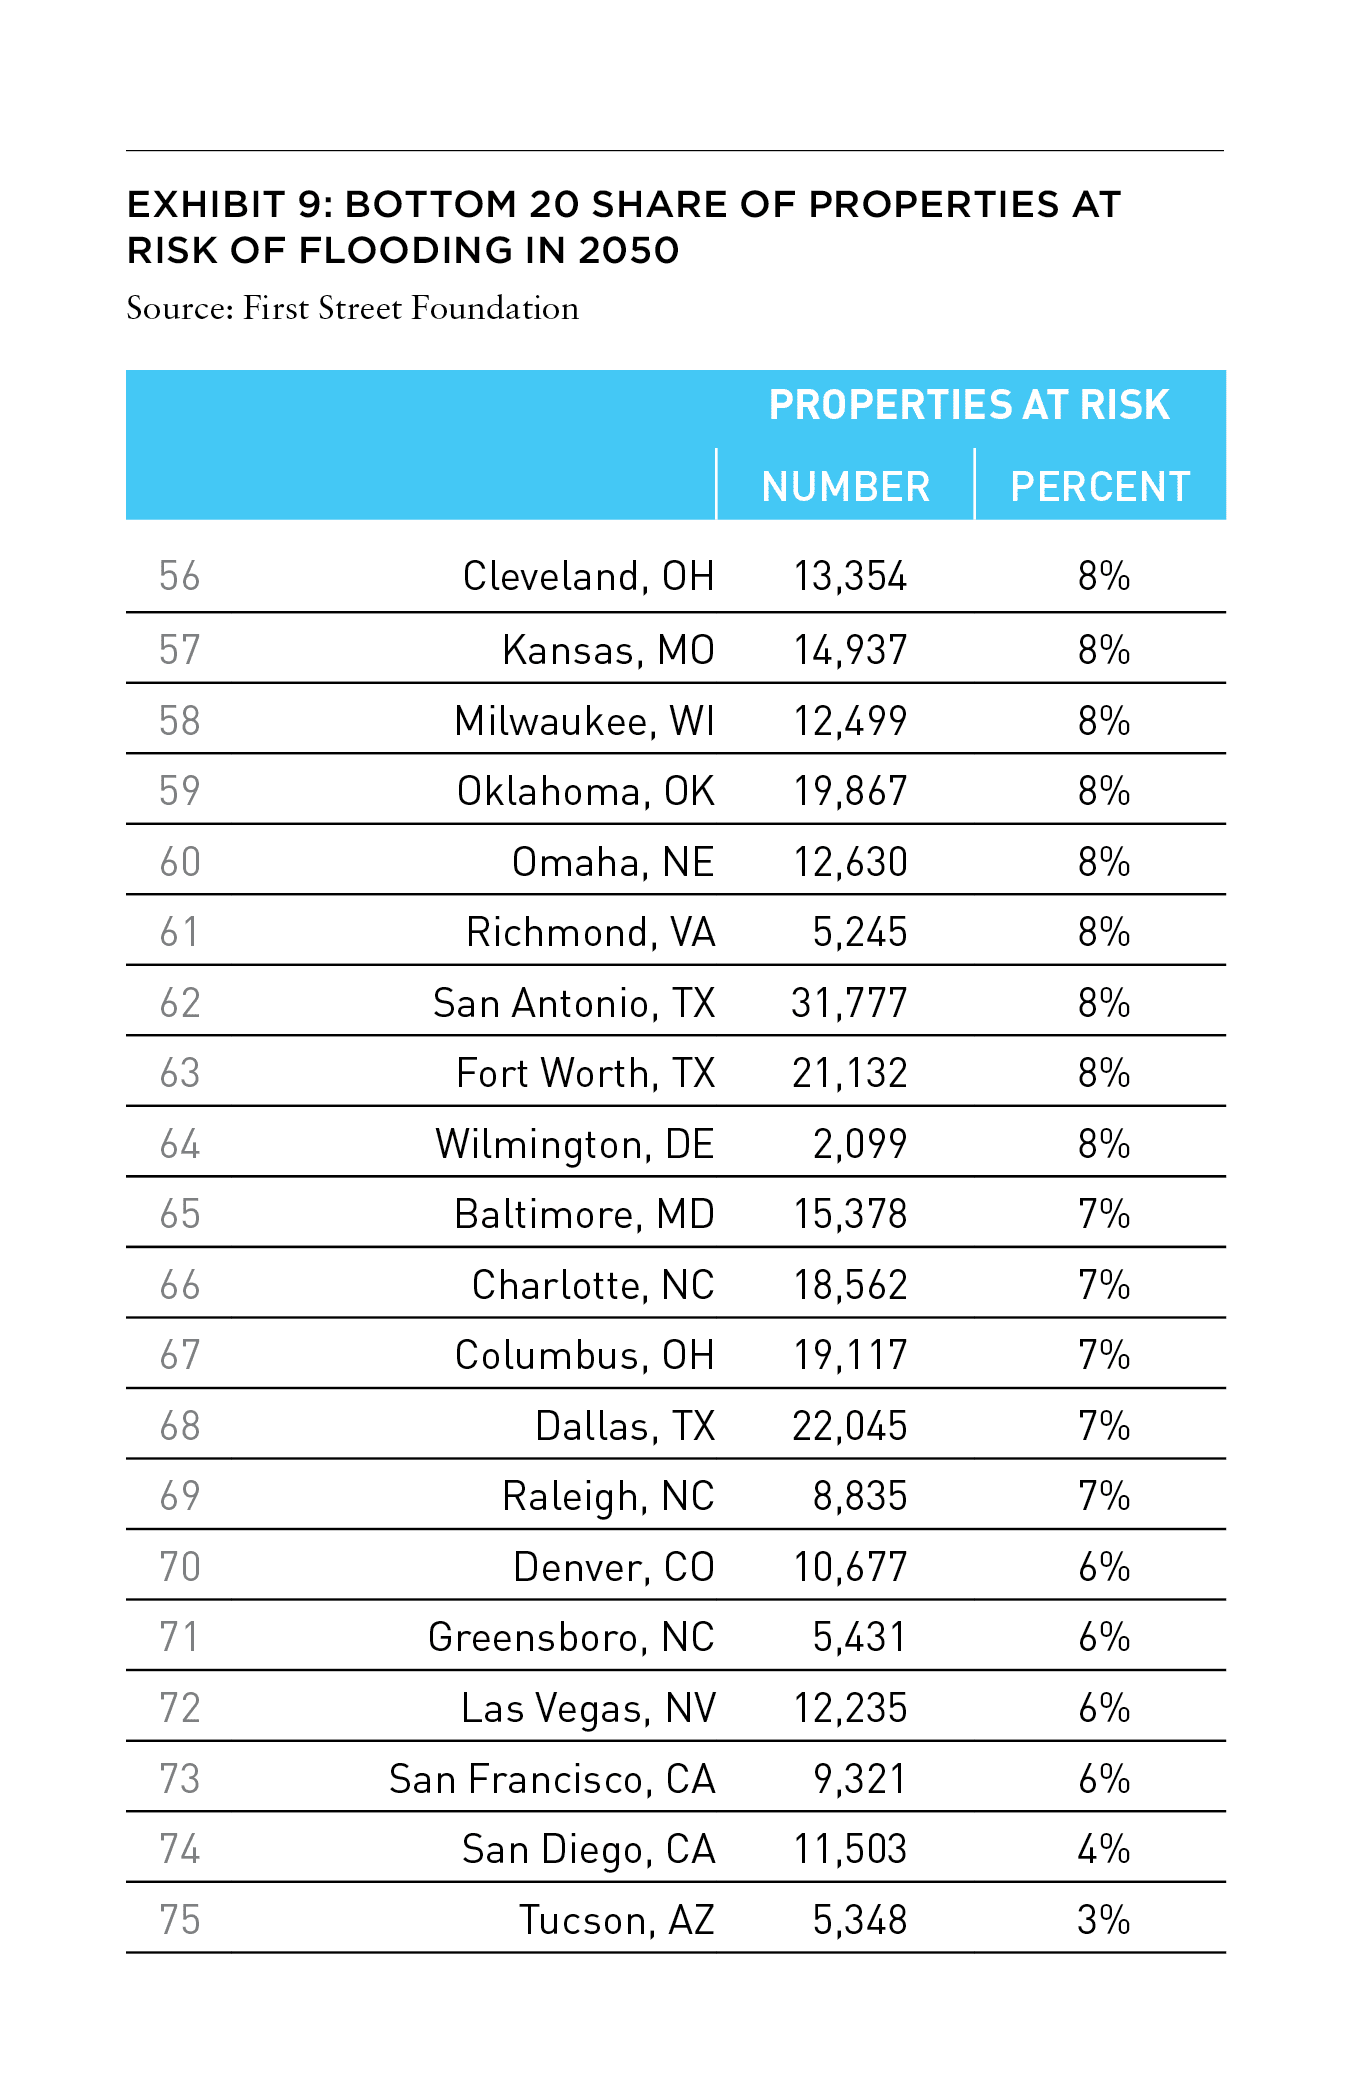
In contrast, there are cities that front oceans and lakes that are not nearly as exposed. These include Milwaukee, Seattle, Cleveland, San Diego, and San Francisco. Desert-bound Tucson and Las Vegas, as well as land-locked Greensboro, NC, and Denver, CO, are also amongst those least likely to suffer substantial flood damage.
CLIMATE CHANGE AND INCREASED FLOODING EXPOSURE
The Arctic sea ice covered 1.4 million square miles in September 2020—the second smallest range of coverage since satellite monitoring began forty years ago.[17] The figure marks the second time that Arctic sea ice dropped below 1.5 million square miles.[18] This key metric for climate change reveals that the low in 2020 was more than 40% below the average from 1981 to 2010. The fourteen years with the lowest sea-ice area have all occurred in the last fourteen years.[19]
Scientists have found that airborne industrial pollution gets captured in snowfall on the glaciers where the black soot sharply diminishes the reflectivity of the ice, which melts into pools, which absorb heat, and melt more ice in a continuous cycle. The meltwater runs down through cracks to the bedrock where it acts like a lubricant to help slide the glacier into the sea where it becomes a giant iceberg that instantly raises sea levels.[20]
Since 1880, the global average sea level has risen eight to nine inches.[21] Melting Arctic ice is expected to speed up sea level rise. Should oceans rise substantially higher, major coastal cities would flood. It is likely that waterfront property in low lying areas will be at serious risk over ten to thirty years. In addition, hurricanes and cyclones have become stronger over the past several years.
Coastal flooding is growing because of the increased frequency of high-tide flooding, the greater magnitude of extreme weather events, and topographical changes. The increases in high-tide flooding and the greater magnitude of extreme weather are likely caused by global warming. Topographical changes, including land subsidence, is caused by commercial and residential development as well as oil and gas extraction.[22]
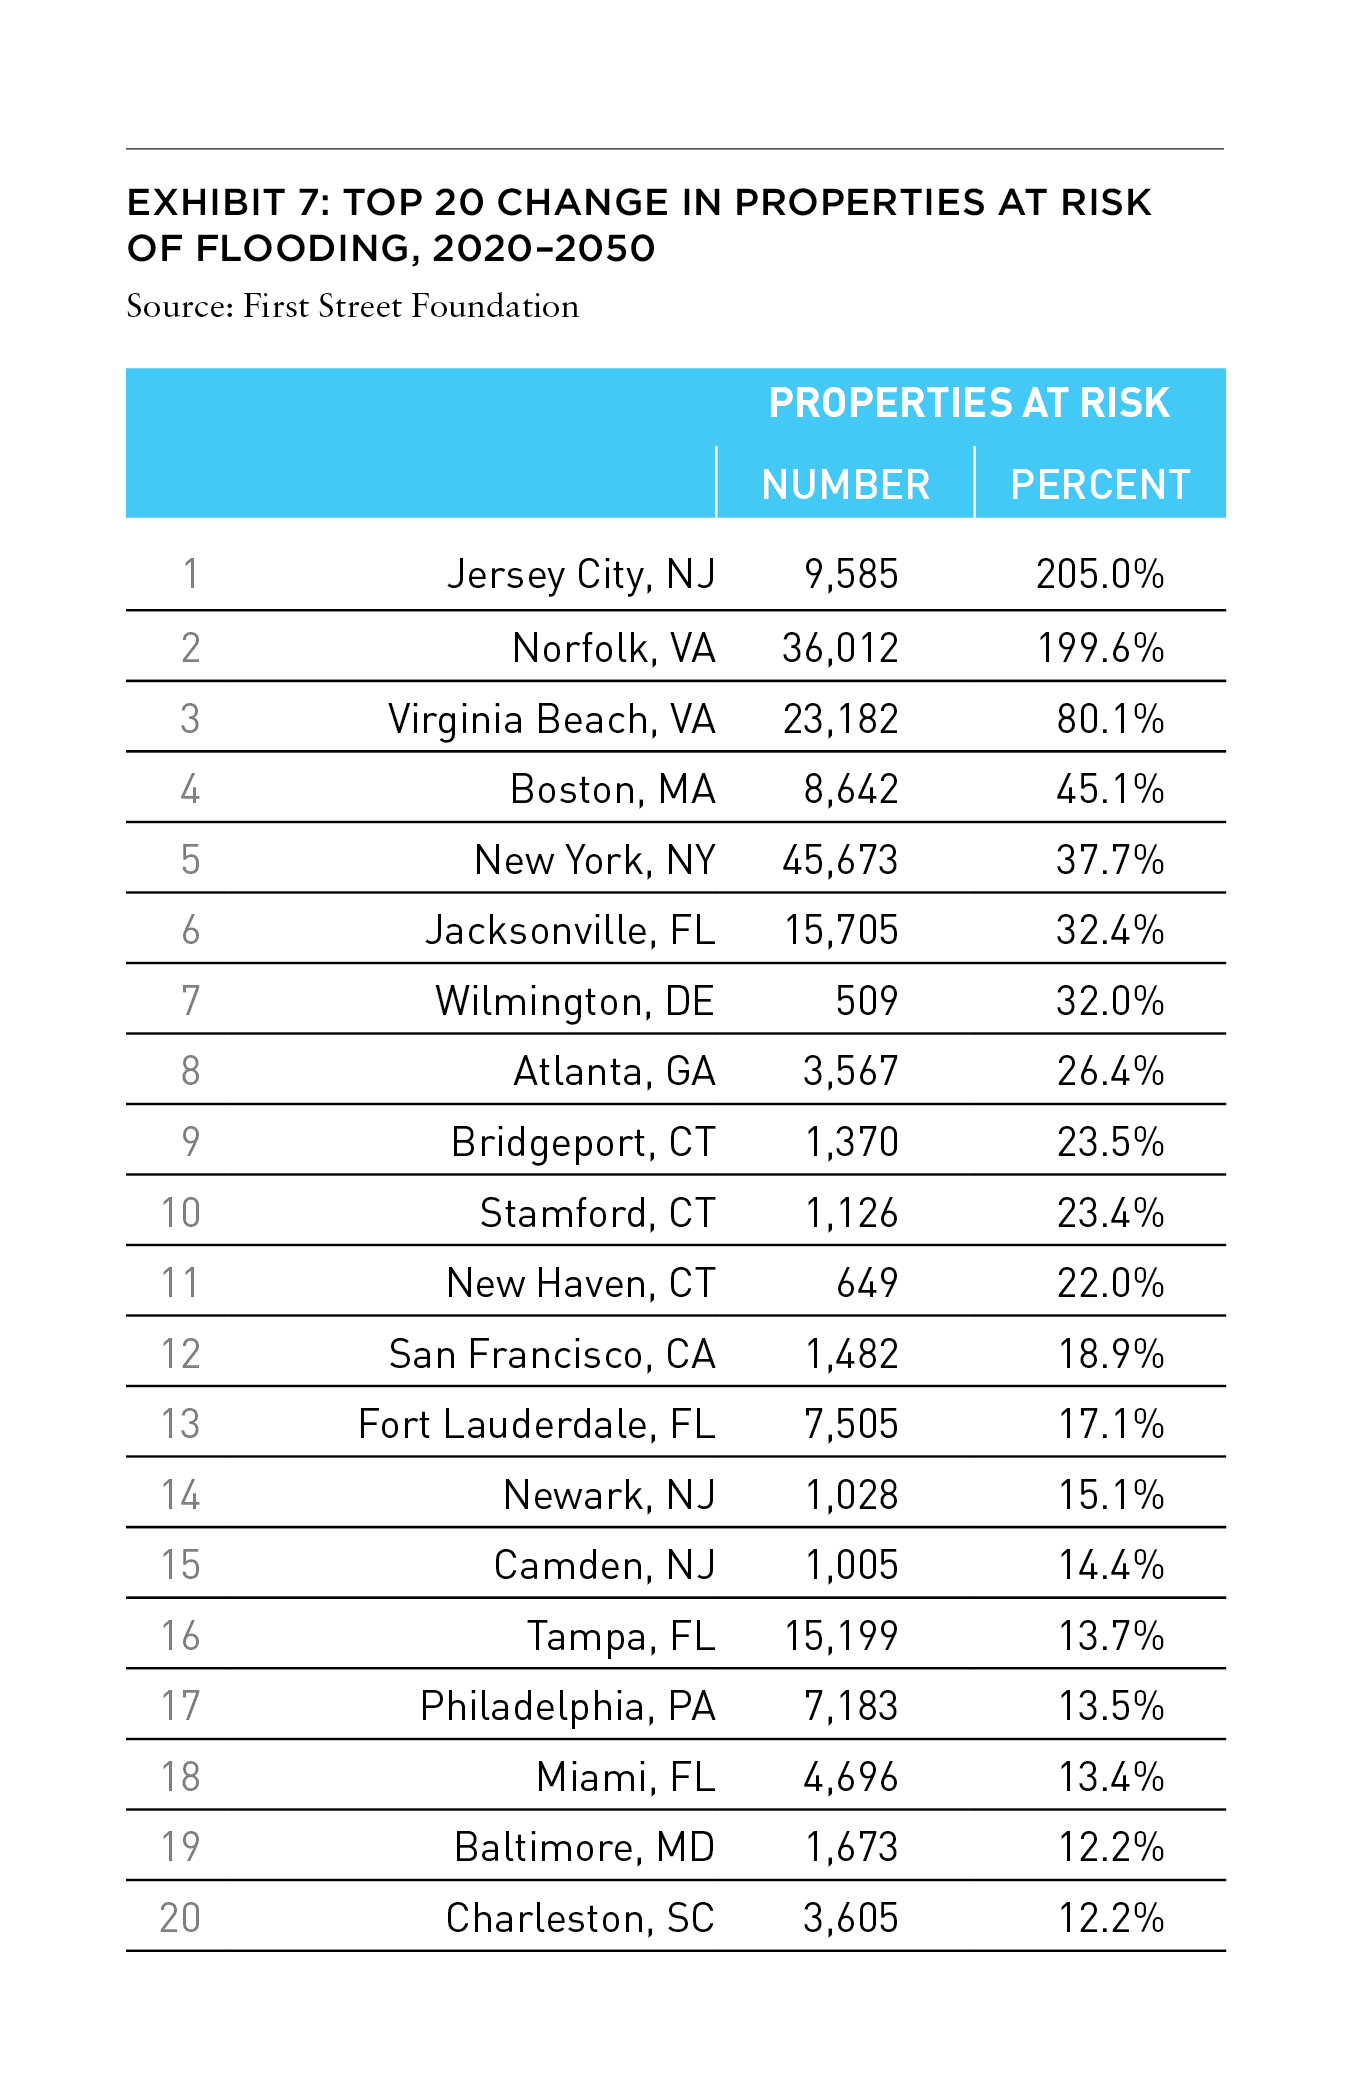
The list of cities projected to be most at risk in 2050 includes some of the same ones noted in 2020. What is particularly of note is the magnitude of change for cities at various levels of current risk. For example, the number of properties exposed in Jersey City, NJ is expected to increase 205% by 2050. Norfolk, VA risk is expected to grow by 200% by 2050, resulting in a jump from the tenth to the third spot on the risk list. Other notable increases in risk exposure include Virginia Beach (80%), Boston (45%), New York (38%), Jacksonville (32%), and Wilmington, DE (32%).
According to several studies cited by the Urban Land Institute, “The impacts of the actual and perceived risks of climate change are already beginning to be reflected in residential market pricing. Studies published in 2017 and 2018 looking at the US, Germany, and Finland found that homes exposed to flood risk or sea-level rise have sold for less than comparable properties or have seen values increase at a reduced rate in comparison to similar properties without flood risk.”[23] The First Street Foundation’s Flood Factor data showed in 2018 that eight states along the eastern seaboard have lost a total of US$14.1 billion in home values in coastal areas because of sea-level-rise flooding since 2005.[24] Cities that can demonstrate that they are fiscally strong, prepared for an emergency, and invest in protective infrastructure, may be better positioned.
CHARLESTON, SC
Charleston is a low-lying port city along the eastern seaboard that is susceptible to continued sea level rise and increased intensity of Atlantic hurricanes. Areas along the ocean, including the Isle of Palms, Stiles Point, and Whitehouse Plantation are vulnerable. Most susceptible, however, is the area of Charleston where the Ashley River meets Cooper River around Charleston Harbor, which includes the area around the Medical University of South Carolina, Charleston Village and South of Broad. The areas mentioned above are yet another example of a classic indicator of where flooding is the most likely: where two rivers converge and form a harbor, specifically in a hurricane prone area. In addition to storm activity, Charleston has also experienced increased king tide flooding.
A specific flooding concern in Charleston is that several hospital campuses are in areas at risk, including the Medical University of South Carolina and Roper St. Francis Hospital. Both have been previously inundated with floodwater, most recently during a tropical storm in 2017, which threatened medical operations around the region. The hospital systems hope the city will take more deliberate measures to protect the hospitals, but this remains an ongoing concern.
In order to mitigate against some of these flooding events, Charleston created a Resiliency and Sustainability Committee which includes members from MUSC and Roper St. Francis. The committee has discussed plans for building green roofs, rain gardens, and cisterns, as well as creating space for storm water storage underground. There are also several large-scale drainage projects underway in certain parts of Charleston. Matthew Fountain, Director of Stormwater Management in Charleston has said “people can expect to see some real flood improvements by the summer of 2022.” [28]
HAMPTON ROADS, VA
The Hampton Roads area (Virginia Beach, Hampton, Newport News, Suffolk, and Norfolk) is host to a natural deep-water harbor at the confluence of three major rivers, with which comes significant risk of flooding. Norfolk is situated at the convergence of the Elizabeth and Lafayette Rivers and is exposed to the greatest flood risk in the area. Newport News and Hampton carry the most risk along the water at the meeting of the James and Elizabeth Rivers. Virginia Beach, however, being located on the Atlantic Ocean, is most vulnerable along the coast, up toward the mouth of the harbor near the Norfolk Naval Station. The Hampton Roads area has experienced the second-highest sea level rise of any region on the Atlantic coast. As noted, Norfolk and Virginia Beach are expected to have substantially higher risk by 2050. In 2016, Virginia was awarded a $120 million grant from HUD for proactive resiliency projects to benefit the entire Ohio Creek watershed area. At the Norfolk Naval Station, millions of dollars have been spent to better secure the power system as well as replace several concrete piers with more resilient floating double-deck piers. [33]
LOS ANGELES
Areas of Los Angeles with the greatest risk of flooding include those in Del Rey, Culver Garden as well as near the Art District and Picfair Village. Many of the streets running north to south in Northern Los Angeles, including neighborhoods like Bel Air, Beverly Glen, Trousdale Estates, and Hollywood Hills can experience flooding from mountainous roadways. Stormwater can and has inundated the areas with muddy runoff as gravity pushes water down the roadways. These roadways provide a natural avenue by which rainwater can follow gravity toward lower ground. Properties in the path of this runoff are subject to flooding. Additionally, Stone Canyon Reservoir in the north can overflow and exacerbate these effects.
SACRAMENTO
Although Sacramento is located inland, it still has substantial flooding risk. Unlike many of the other locations we’ve discussed which are prominently located along large bodies of water, Sacramento’s risk is different. At the north of the city, the American River meets the winding Sacramento River, forming a Y-shaped confluence. Additionally, a few miles south near the Land Park neighborhood, a human-made shipping channel called the Sacramento River Deep Water Ship Channel was created to stretch nearly 30 miles to connect Sacramento with bays and waterways that lead into the San Francisco Bay. The confluence of these various waterways all within a small area create flooding risk as rainfall is more likely to overflow the banks of these rivers.
Beginning more than a century ago, 1,100 miles of levees have been constructed in the area. During the Great Flood of 1862, weeks of continuous rain left some areas of Sacramento under 30 feet of water, forcing the state capital to be temporarily moved to San Francisco. More recently, in 1986 and 1997, deadly floods have overpowered levee systems and destroyed thousands of homes in the metro area. [27]
HOUSTON
Houston, the winner in its rivalry with Galveston over a century ago, has a high level of flood risk exposure which has ratcheted up by a level of magnitude over the past several decades. Industrialized groundwater extraction used for oil and gas production as well as a surging population has resulted in more than 10 feet of subsidence in some areas of Houston. As a result, there has been a significant increase in flooding risk caused by sinking land over the past 40 years.
Houston is exposed to hurricane flooding risk from Gulf storms. Neighborhoods and nearby cities of the most concern include Bellaire, Southside Place, West University Place, Sugar Land, Mission Bend, Meadows Place, and Town West. Additionally, locations specifically along Oyster Creek, the Brays and Buffalo Bayous carry substantial risk. Hurricane Harvey (2017) caused US$125 billion worth of economic damage. [31]
In 2019, $4 billion in new federal funding for flood prevention provided by HUD was announced. Texas Governor Greg Abbott said the block grant will be managed by the Texas General Land Office for “large-scale, regional projects that increase the state’s resilience to disasters statewide, protect lives and mitigate against future hurricanes and other natural disasters.” [32] This program represents the largest series of flood mitigation projects in the state’s history.
NEW ORLEANS
In August 2005, Hurricane Katrina caused over 1,800 deaths and $125 billion in damage primarily in the greater New Orleans area. New Orleans carries significant risk of flooding to many of its neighborhoods. In fact, about half of New Orleans, much of which is flanked by Lake Pontchartrain and the Mississippi River, is located between 5 to 10 feet below sea-level. Areas of particular concern include those along Lake Pontchartrain, Ferncrest, Barrington Park, and those near New Orleans International Airport. Flooding in these areas are managed by a series of levees and floodgates, and nearly 200 drainage pumps. Maintaining and reinforcing these levees and drainage pumps (many of which did not function properly during Hurricane Katrina) have been of chief importance to local governments.
Nevertheless, New Orleans is one of the lowest of low-lying areas in the US, and its capacity to handle future sea-level rise and the increased frequency of future storms relies heavily on its drainage systems. According to the New Orleans Sewerage and Water Board, the city’s drainage pumping system can currently handle rainfall and subsequent flooding, if it does not exceed one inch in the first hour followed by 0.5 inches per hour afterward. This limit has been easily exceeded during certain storms and remains of dire concern going forward. [26]
MIAMI
Miami is exposed to significant potential flooding through the entire metro area. Areas with outsized risk include those along the Miami River which encompasses everything from Miami International Airport along to the ocean. All the barrier islands around Miami Beach, as well as El Portal and Keystone Islands are at substantial risk. Inland very low-lying areas such as West Miami are also at risk. There are two main hazards to Miami real estate. Firstly, the concern of more frequent “king tides”, which are higher than normal high- tides not associated with storm activity but with general sea level rise. This phenomenon is becoming more common place. This, coupled with the area being a hurricane-prone region, makes it extremely vulnerable to flooding events, even in the near-term.
Miami has taken some steps to reduce risk, including raising or moving certain roadways, installing pumping stations, as well as the construction and maintenance of natural features including mangroves, reefs, and dedicated wetlands. Additionally, discussions among municipalities to fortify water reservoirs from potential saltwater inundation during storm events have been discussed throughout Florida. Nevertheless, Miami carries significant risk through the area and may be one of the first American cities to be dramatically affected by climate change.
FORT LAUDERDALE & WEST PALM BEACH
Like Miami, Fort Lauderdale also carries significant risk. This includes the barrier island neighborhoods of Harbor Beach and Central Beach, as well as inland along the New River through Las Olas and Sailboat Bend toward South Fort Lauderdale. The many small canals that make up neighborhoods like Idlewyld, Henricks and Venice Isles, and Harbor Beach translate to substantial flooding risk to every property in this area.
Northward toward Palm Beach, the significant risk is similar. All of the city carries some level of risk, with the strongest exposure in areas facing the inland waterway between West Palm Beach and the barrier island of Palm Beach.
TAMPA & ST. PETERSBURG
Most of the Tampa and St. Petersburg metro area is low-lying and at risk of flooding and exposed to the king tides. Areas of particular concern include Sunset Beach and Port Tampa, as well as Shore Acres, and the barrier island from Clearwater down to St. Pete Beach. St. Petersburg is at even greater risk than Tampa because it has direct exposure to the Gulf of Mexico. In the summer of 2015, Tampa experienced its worst flooding event in nearly 65 years where 15-20 inches of rain fell in the area over 10 days during a storm unrelated to a hurricane. [30] Communities in the Tampa metro area have taken proactive steps toward improving community preparedness for future storms of a similar or worse magnitude, which are likely to only increase in frequency.
NEW YORK, NY
New Jersey and New York (Long Island) form a near triangle at the base of New York Harbor, and this confluence and bottleneck of water create a vulnerability if storm surges coming up the coast are stronger in the future. Areas of concern include those along the low-lying waterfront neighborhoods like Chelsea and the Financial District, specifically near the South Street Seaport. The Brooklyn neighborhoods of Howard Beach, Coney Island, and other areas along the Atlantic Ocean have the highest risk of potential flooding. Locations with direct ocean, harbor, and river exposure as well as locations along inland streams are vulnerable including areas near Newtown Creek and the Gowanus Canal in Brooklyn. Additionally, the majority of Staten Island is susceptible to severe flooding due to its location at the base of New York Harbor, where storm surges may have the greatest force.
In the wake of the 2012 Storm Sandy, the Metropolitan Transit Authority (MTA) created a “Fix and Fortify” program and plans to put $10.5 billion into repairs and upgrades in the coming years. [25] Additionally, the city has been experimenting with flood-gate style infrastructure for its subway network, which experienced crippling flooding during past storms.
JERSEY CITY & HOBOKEN
Across the Hudson River in Jersey City, NJ, the highest risk is near Colgate Center and Paulus Hook toward Liberty Harbor and the Jersey City Medical Center. Additionally, neighborhoods like Hamilton Park and areas along Martin Luther King Jr. Blvd. also carry risk. Northward, Hoboken is even lower lying than Jersey City and includes universally significant risk throughout the city. As noted, Jersey City’s risk is expected to more than double by 2050.
CHICAGO
In Chicago, the majority of the flood risk is found along the North and South Forks of the Chicago River, as well as the Chicago Sanitary and Ship Canal. In fact, areas directly along Lake Michigan are at less risk than areas along these slightly more inland waterways. These areas include Wicker Park down to River West, as well as McKinley Park and Bridgeport to the south.
Flooding in urban areas throughout Illinois, mainly in Chicago, caused over $2 billion in damages between 2007 and 2014, and has been increasing. [29] This year has already marked the third year in a row that Chicago set a precipitation record. Earlier in 2020, the city of Chicago and the Metropolitan Water Reclamation District began implementing new standards that will require new developments to include plans for managing flooding and stormwater runoff before they will be allowed to build.
PLANNING FOR FUTURE RISKS
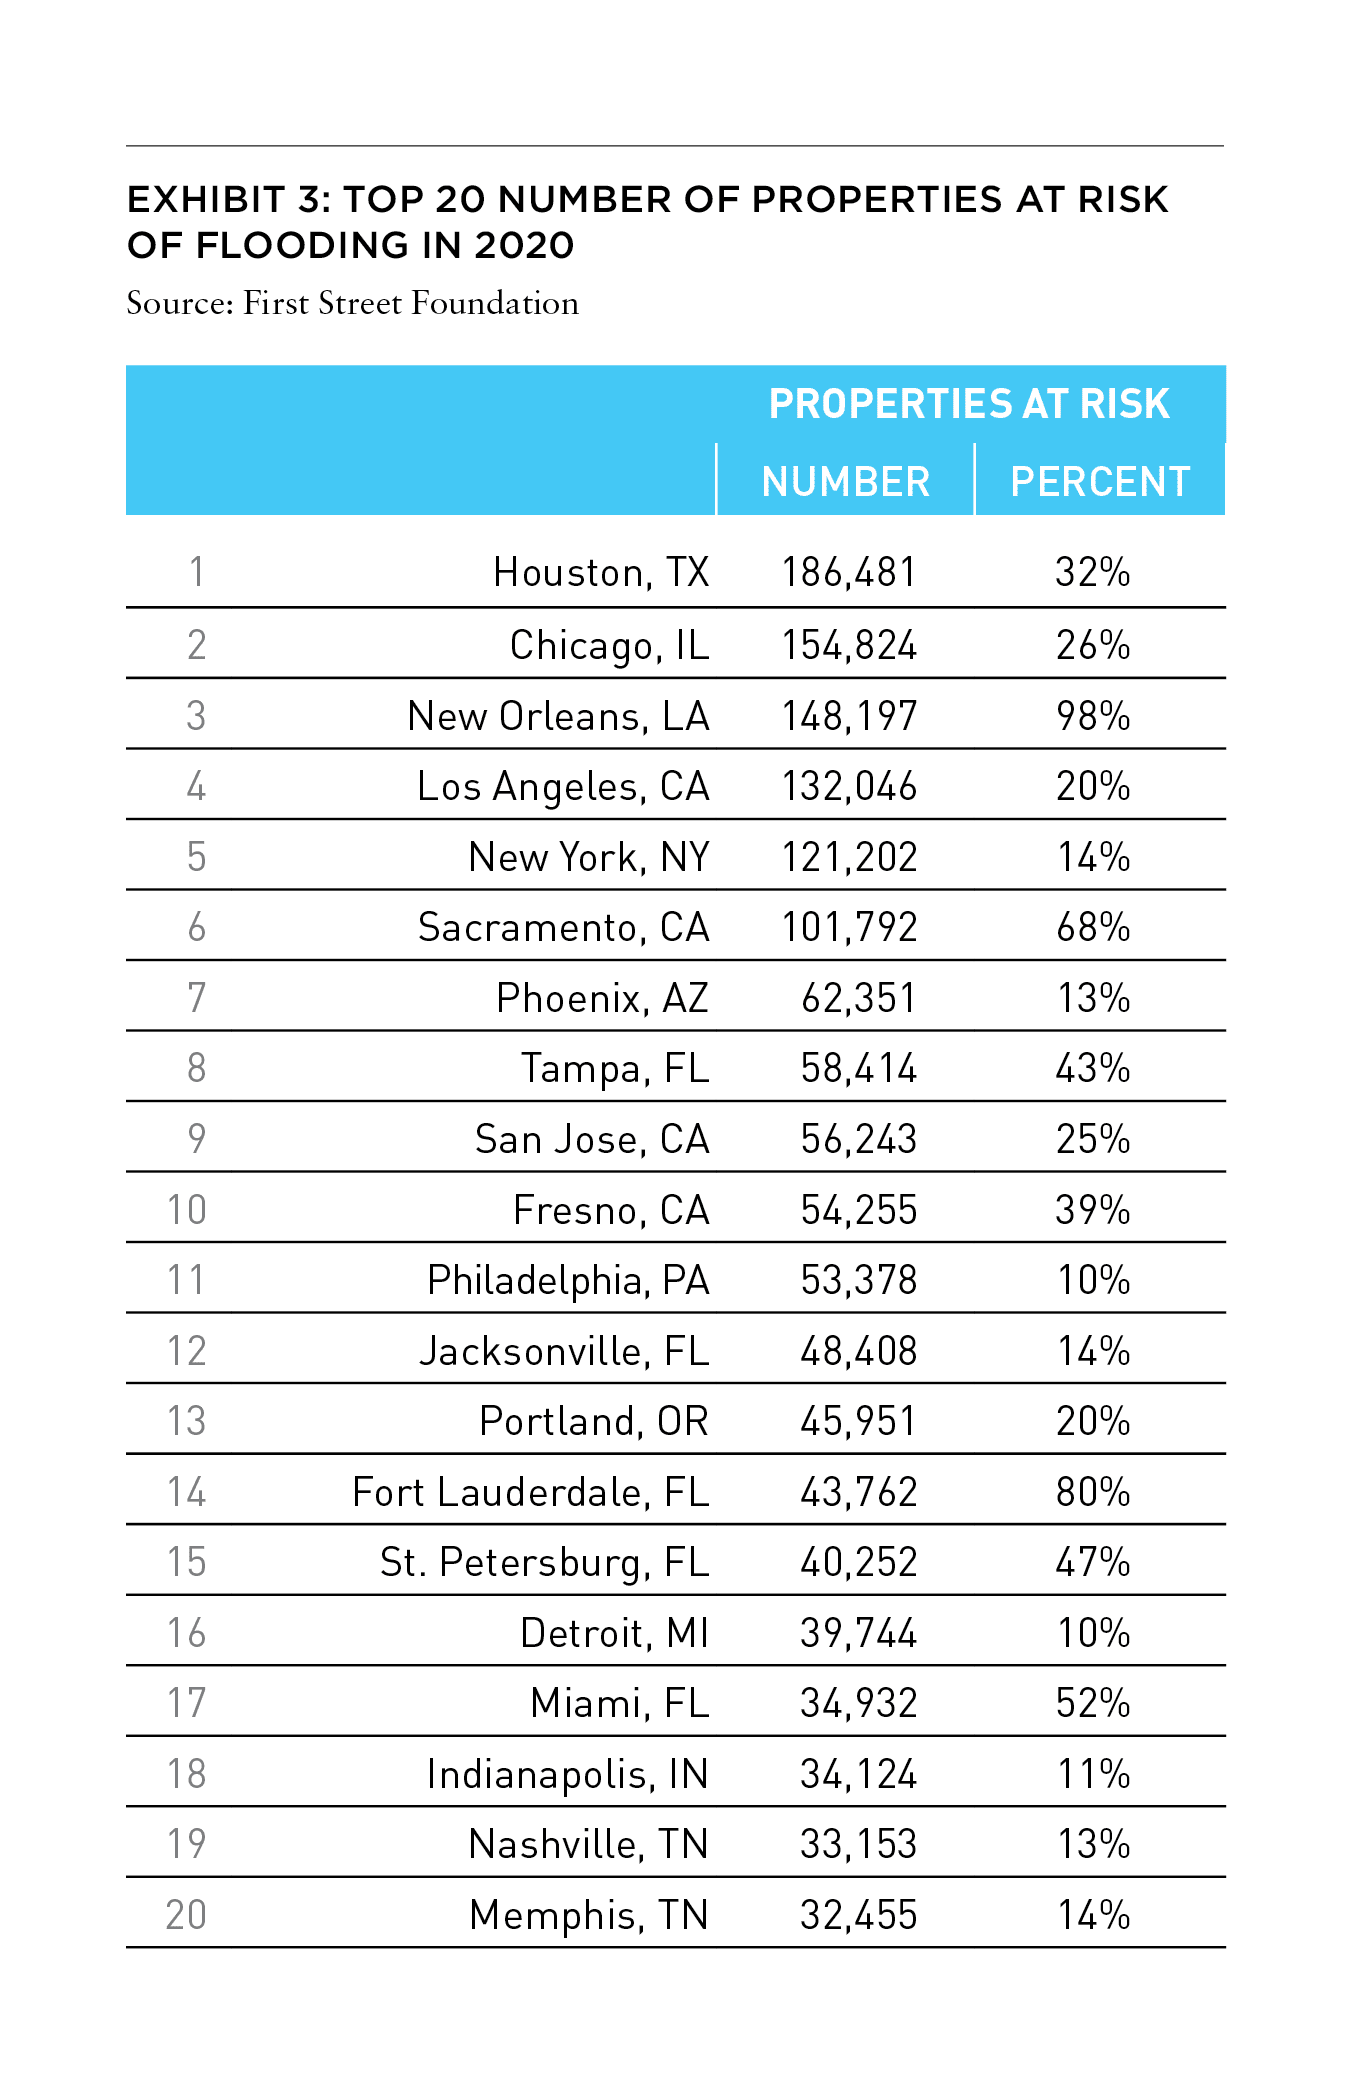
Damage from coastal flooding, fluvial, pluvial, storm surge, industrialized groundwater extraction, and tidal sources are significant risks in certain metro areas. New Orleans, plus four Florida cities, take five out of the top seven risk positions ranked by share of metro properties. In terms of number of exposed properties, Houston, Chicago, New Orleans, Los Angeles, and New York are the most at risk. Historically, there have been times when extreme weather resulting in flood damage changed the fortunes of cities. Climate change is placing formerly and relatively safe areas at risk and will likely alter investment decisions. The gradual increase in sea levels can adversely impact demand for CRE in coastal areas. Jersey City, NJ as well as the Hampton Roads cities of Norfolk and Virginia Beach are expected to see the greatest increase in water damage exposed properties over the next twenty years.
The impact of signifi cant water damage potential on CRE values is refl ected in lower rent and occupancy as well as the higher costs of insurance, repair and maintenance, and capital reserves. The potential likelihood of catastrophic water damage will impact the size of the universe of possible investors in exposed areas.
Investors need to be cognizant of water disaster potential not only in target properties but also in the asset area. The magnitude of water damage risk is a major consideration in twenty-first century CRE investing. It is important to differentiate short-term interruption from long-term secular consequences. Likewise, it is vital to bifurcate the practical risk implications of investing with a seven- to ten-year holding period verses an investment horizon that would not concern the grandchildren of anyone living today.
DOWNLOAD A PDF OF THIS ARTICLE
—
ABOUT THE AUTHORS
Stewart Rubin is Senior Director and Head of Strategy and Research, and Dakota Firenze is a Senior Associate, for New York Life Real Estate Investors, a division of NYL Investors LLC, a wholly-owned subsidiary of New York Life Insurance Company.
—
NOTES
[1] Unknown ancient Mesopotamian authors, N.K. Sandars (translator, introduction) The Epic of Gilgamesh, The Story of the Flood, (Penguin Classics, 1987), circa 1,800 BCE, 112.
[2] “Galveston marks anniversary of disaster,” Longview News-Journal, Associated Press, 9 September 2000, 4A.
[3] Eric Larson, “Isaac’s Storm, A Man, a Time, and the Deadliest Hurricane in History,” (Random House, 2011)
[4] US Census Bureau, census.gov
[5] “Costliest U.S. Tropical Cyclones Tables Updated,” National Oceanic and Atmospheric Administration, 26 January 2018, nhc.noaa.gov/news/UpdatedCostliest.pdf
[6] “Deaths Associated with Hurricane Sandy — October–November 2012”. Centers for Disease Control and Prevention Morbidity and Mortality Weekly Report, 24 May 2013, Retrieved 13 October 2020.
[7] Sarah Crichton, “Officials: Sandy Destroys More Than 2,000 Ll Homes,” Newsday, Last Updated 10 December 2012, newsday.com/long-island/officials-sandy-destroys-more-than-2-000-li-homes-1.4316744
[8] US Census Bureau, census.gov the fact that the populations of Queens and Kings Counties declined by 0.8% and 0.2% during the observation period was not necessarily the result of the damage inflicted on coastal areas.
[9] “Costliest U.S. Tropical Cyclones Tables Updated,” National Oceanic and Atmospheric Administration, 26 January 2018, nhc.noaa.gov/news/UpdatedCostliest.pdf
[10] “Hurricane Harvey,” Complete, 1 April 2020, teamcomplete.com/hurricane-harvey/
[11] US Census Bureau, census.gov
[12] “Futureproofing Real Estate From Climate Risks: ULI Research in Partnership with Heitman,” ULI Americas, Last Accessed 15 March 2021, americas.uli.org/research/centers-initiatives/urban-resilience-program/climate-and-real-estate-investment/
[13] “Futureproofing Real Estate From Climate Risks: ULI Research in Partnership with Heitman,” ULI Americas, Last Accessed 15 March 2021, americas.uli.org/research/centers-initiatives/urban-resilience-program/climate-and-real-estate-investment/
[14] Charlie Wood, “US Flood Risk Awareness Increasing as major insurers pull back”, Reinsurance News, 26 September 2019, AIG and Zurich, have begun to considerably pull back exposure from certain markets prone to catastrophe losses
[15] “The First National Flood Risk Assessment, Defining America’s Growing Risk,” First Street Foundation, 2020, assets.firststreet.org/uploads/2020/06/first_street_foundation__first_national_flood_risk_assessment.pdf: “The model was produced in partnership with researchers and hydrologists from First Street Foundation; Columbia University; Fathom; George Mason University; Massachusetts Institute of Technology; Rhodium Group; Rutgers University; The University of California, Berkeley; and University of Bristol. This collaboration makes use of open government data and builds upon decades of research, modeling, and expertise, brought together to develop a high-resolution, property-specific flood risk information at a national scale. First Street Foundation is a non-profit research and technology group committed to defining America’s flood risk. The Foundation provides this information for every property in the contiguous US, in a format that is publicly and freely accessible via Flood Factor™, an online database and visualization tool(www.floodfactor.com). The tool presents past, present and future flood risk with particular attention paid to recent and projected environmental changes contributing to flood risk. The public availability of this data is a benefit for property owners, and the wider public, as it represents the first freely available data of its kind across the nation.”; According to First Street Foundation, the model has certain advantages over FEMA maps as it contemplates the risk from any type of flooding event by considering inundation from fluvial (riverine), pluvial (rainfall), storm surge, and tidal sources. The national results indicate that the First Street model generally captures approximately 1.7 times as many properties at risk as the FEMA SFHA designation. An analysis of these differences reveals that the inclusion of pluvial flood risk, sea level rise, and ungauged streams are responsible for most of this additional risk.
[16] As with all such references in this report—exposure is based on First Street data. assets.firststreet.org/uploads/2020/06/first_street_foundation__first_national_flood_risk_assessment.pdf
[17] Laura Millan Lombrana and Eric Roston, “Arctic Sea Ice Shrank to Its Second-Lowest Level on Record”, Bloomberg News, 21 September 2020
[18] https://nsidc.org/arcticseaicenews/
[19] Laura Millan Lombrana and Eric Roston, “Arctic Sea Ice Shrank to Its Second-Lowest Level on Record”, Bloomberg News, September 21, 2020, bloomberg.com/news/articles/2020-09-21/arctic-ice-shrank-to-second-lowest-level-on-record-due-to-warming
[20] “The Life of a Glacier,” National Snow & Ice Data Center, Last updated 15 March 2020, nsidc.org/cryosphere/glaciers/life-glacier.html; Susan Cosier, “Greenland Is the New Black,” OnEarth, nrdc.org/onearth/greenland-new-black Chris Caulfield, “Huge Ice Sheet Breaks Off Greenland Glacier Amid Rising Temperatures,” 14 September 2020, metro.co.uk/2020/09/14/42-3-square-mile-ice-shelf-breaks-off-greenland-glacier-amid-rising-temperatures-13271484/
[21] Rebecca Lindsey, “Climate Change: Global Sea Level,” Climate.gov, 25 January 2021, climate.gov/news-features/understanding-climate/climate-change-global-sea-level
[22] First Street Foundation, The First National Flood Risk Assessment, Defining America’s Growing Risk, 2020
[23] “Futureproofing Real Estate From Climate Risks: ULI Research in Partnership with Heitman,” ULI Americas, Last Accessed 15 March 2021, americas.uli.org/research/centers-initiatives/urban-resilience-program/climate-and-real-estate-investment/; Asaf Bernstein, Matthew Gustafson, and Ryan Lewis, “Disaster on the Horizon: The Price Effect of Sea Level Rise,” Journal of Financial Economics, 4 May 2018; “As The Seas Have Been Rising, Tri-State Home Values Have Been Sinking,“ First Street Foundation, 23 August 2018, firststreet.org/press/as-the-seas-have-been-rising-tri-state-home-values-have-been-sinking/; Jesse H. Keenan, Thomas Hill, and Anurag Gumber, “Climate Gentrification: From Theory to Empiricism in Miami-Dade County, Florida,” Environmental Research Letters 13, 23 April 2018; Jens Hirsch and Jonas Hahn, “How Flood Risk Impacts Residential Rents and Property Prices: An Empirical Analysis,” Journal of Property Investment & Finance, 36.1 (2017), 50–67; Athanasios Votsis and Adriaan Perrels, “Housing Prices and the Public Disclosure of Flood Risk: A Difference-in-Differences Analysis in Finland,” Journal of Real Estate Finance Economics 53.4 (November 2016), 450–471.
[24] Jameelah D. Robinson, “Real Estate Investors Want to Know What Cities Are Doing About Climate Risks,” Bloomberg News, 30 October 2020, bloomberg.com/news/articles/2020-10-30/real-estate-investors-expand-models-for-climate-risks
[25] “One New York: The Plan for a Strong and Just City”, The City of New York, 2015 nyc.gov/html/onenyc/downloads/pdf/publications/OneNYC.pdf
[26] Kevin Litten, “Can New Orleans Drain An Inch of Rain In The First Hour Of A Storm? City Officials Seek Proof,” Nola.com, 25 August 2017, nola.com/news/politics/article_2a14e3f2-c4b3-599a-bd0c-ba64531257bb.html
[27] Ezra Romero, “Could Sacramento Flood Like New Orleans? It’s Possible, But Water Managers Are Trying To Make It Less Likely”, Capradio.com, 21 January 2020 capradio.org/articles/2020/01/21/could-sacramento-flood-like-new-orleans-its-possible-but-water-managers-are-trying-to-make-it-less-likely/
[28] Caroline Balchunas, “Charleston Leaders Working On New Flood Mitigation Efforts,” ABC News, 17 September 2020, abcnews4.com/news/local/asdf-09-17-2020
[29] Patrick O’Connell and William Lee, “More Rain, More Floods, More Often. Why Wet Basements and Swollen Rivers Are Becoming The New Spring Reality For Illinois”, Chicago Tribune, 22 May 2020. chicagotribune.com/news/breaking/ct-illinois-floodplains-extreme-weather-20200522-wlnu3qpasrhi7g32no5w3xuhge-story.html
[30] Nick Merianos, “Five Years Since The Infamous Tampa Bay Flood,” Spectrum News, 6 August 2020, baynews9.com/fl/tampa/weather/2020/08/06/five-years-since-the-infamous-tampa-bay-flood
[31] Costliest U.S. Tropical Cyclones Tables Updated,” National Oceanic and Atmospheric Administration, 26 January 2018, nhc.noaa.gov/news/UpdatedCostliest.pdf
[32] “Governor Greg Abbott Taps Commissioner George P. Bush To Lead Historic $4 Billion Comprehensive Mitigation Plan”, Office of the Texas Governor, 4 October 2019, gov.texas.gov/news/post/governor-greg-abbott-taps-commissioner-george-p-bush-to-lead-historic-4-billion-comprehensive-mitigation-plan
[33] Laura Parker, “Who’s Still Fighting Climate Change? The US Military”, National Geographic, 7 February 2017 nationalgeographic.com/news/2017/02/pentagon-fights-climate-change-sea-level-rise-defense-department-military/
—
DISCLOSURE
NYL Investors LLC: The information presented has been prepared by Real Estate Investors for informational purposes only and sets forth our views as of this date. The underlying assumptions and our views are subject to change. This does not constitute investment advice and should not be used as a basis for any investment decision. There is no guarantee that market expectation will be achieved.
The comments, opinions, and estimates contained herein are based on and/or derived from publicly available information from sources that Real Estate Investors believes to be reliable. We do not guarantee the accuracy of such sources or information.
No part of this material may be i) copied, photocopied, or duplicated in any form, by any means, or ii) redistributed without Real Estate Investors prior consent.
Real Estate Investors is an investment group within NYL Investors LLC. NYL Investors LLC (“NYL Investors”) is a direct wholly-owned subsidiary of New York Life Insurance Company. NYL Investors is comprised of the following investment groups: (i) Fixed Income Investors, (ii) Private Capital Investors and (iii) Real Estate Investors.
NYL Investors is not registered in every jurisdiction and their products or services of are not available, and materials relating to them will not be distributed, to any person domiciled in any jurisdiction or region where such distribution would be contrary to local law or regulation.
NYL Investors affiliates may develop and publish research that is independent of, and different than, the views expressed.
CoStar Realty Information, Inc.: The forward-looking information prepared by CoStar Realty Information, Inc. (“Licensor”) and presented herein is based on information from public and proprietary sources, as well as various assumptions concerning future events that are uncertain and subject to change without notice. Actual results and events may differ materially from those expressed or implied by the Licensor data presented. All Licensor data contained herein speaks only as of the date referenced, may have materially changed since such date, and is provided “as is” with no guarantee or warranty of any kind. Licensor has no obligation to update any of the Licensor data contained herein. None of the Licensor data contained herein should be construed as investment, tax, accounting or legal advice.