

The global economy emphasized efficiency over the past forty years in an “asset-lite” system built through integration to lower costs.
This created a system that prioritized lean inventory management, offshore manufacturing, and interconnected supply chains.
However, government and business decision-making has evolved since the pandemic to place greater emphasis on resiliency and security following vulnerabilities exposed by macro shocks and geopolitical considerations.
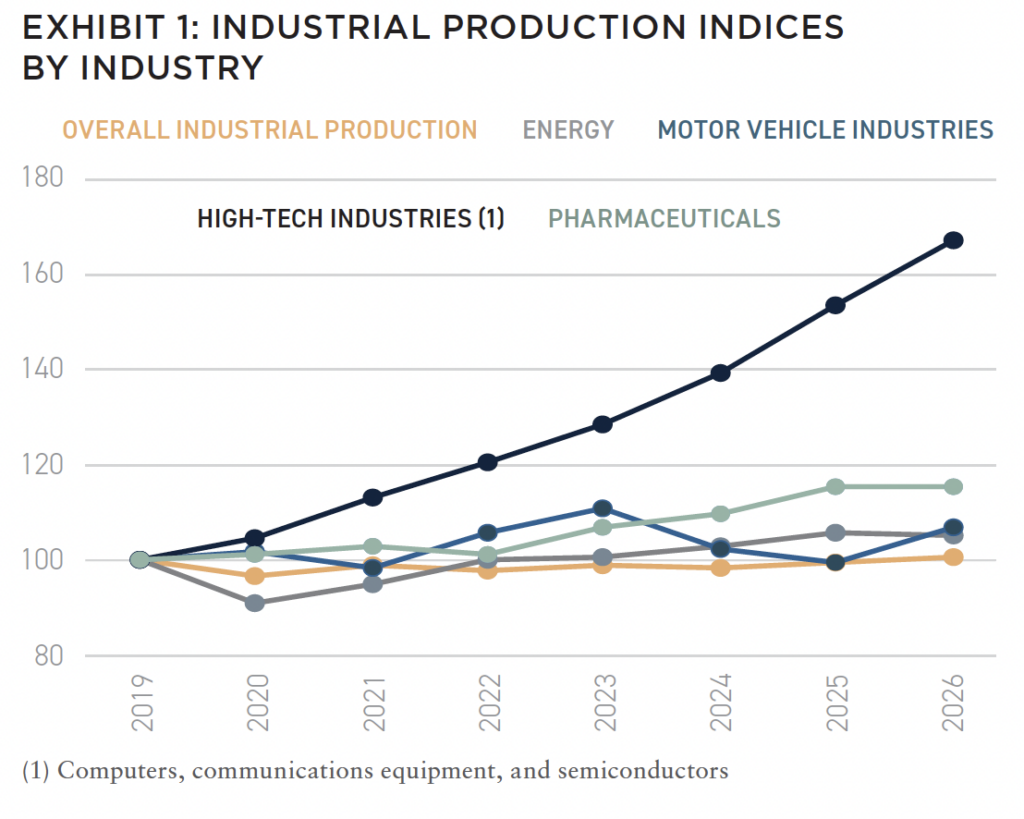
Technology, natural resources, and pharmaceuticals are increasingly viewed as strategic national priorities on a global scale (Exhibit 1). The result is an “asset-heavy” system of embedded redundancies and a structural reindustrialization of the US economy, following decades of under-investment.
The resiliency build-out is resource intensive, as significant funding and capital goods are needed to support domestic manufacturing, technology advancements, national defense, and the infrastructure that connects them. As a measure of magnitude, hyperscaler capital expenditures as a percentage of US GDP in 2026 are forecast to reach levels on par with peak spending on railroads in the 1850s.[i] An economic system with embedded redundancies is by nature less efficient as it requires more production capacity, equipment, and physical space than the efficient, offshored, and interconnected system it replaces.[ii]
Industrial real estate is at the center of this transition with implications based on the end-user customer from a market and product type perspective. All aspects of the resiliency era—domestic production, AI and infrastructure, and expanded defense spending—require industrial space. At the same time, the forces that define this structural shift—most notably power scarcity, tariffs, resource competition, and rising construction costs—are limiting new supply.
The combination of these supply and demand factors has stabilized real estate fundamentals in recent quarters as industrial availability declined in the second quarter for the first time in three years.[iii]
ADDED LAYERS OF INDUSTRIAL DEMAND
Industrial demand has been led by trade volumes, e-commerce adoption, goods distribution, and related drivers over the past cycle. But the current environment is notable for its expanded set of demand drivers, layering on the traditional sources with increased resiliency features.
Reshoring of Manufacturing
There has been significant investment in domestic manufacturing, particularly in strategically important industries such as technology and semiconductors, biomanufacturing and pharmaceuticals, energy, automotive and transportation.
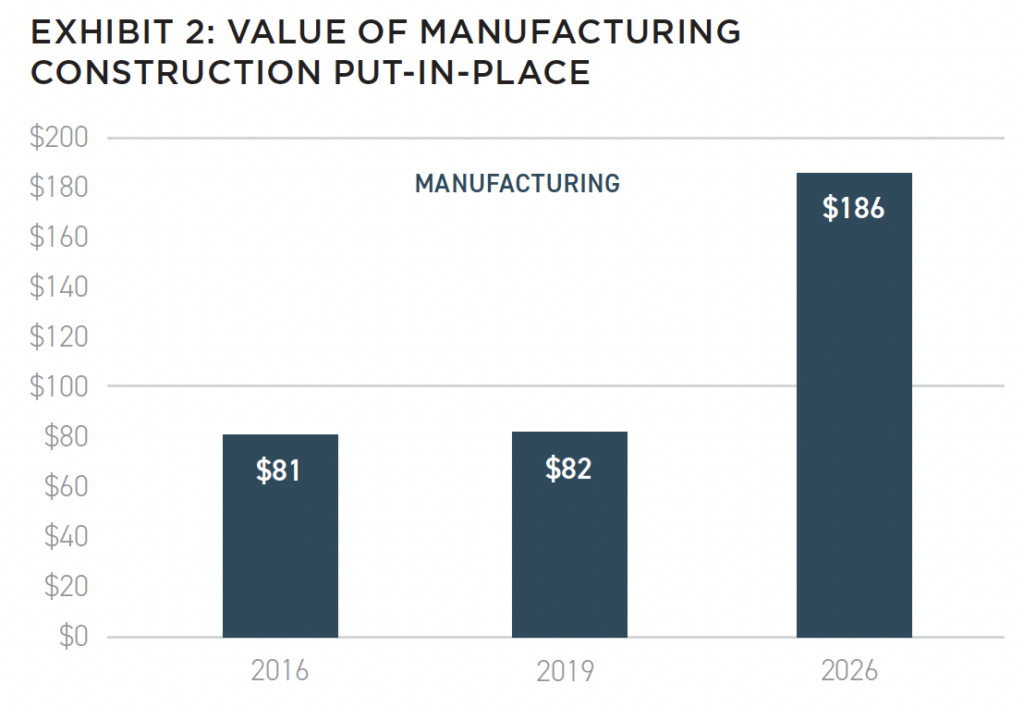
US production capabilities are increasingly viewed through national security, economic, and political lenses and are encouraged through policies such as subsidies and tariffs. This has led to more than $185 billion in manufacturing real estate construction in 2026, up from about $80 billion pre-pandemic, with an additional $770 billion in broader planned investment (Exhibit 2).[iv] The real estate implications extend beyond just the manufacturing plants. Large advanced-manufacturing facilities create an ecosystem of suppliers and operating partners that increases demand for nearby industrial space. Reshoring also changes inventory management as firms diversify away from extended supply chains and tend to hold more safety stock domestically.
AI and Infrastructure Build-Out
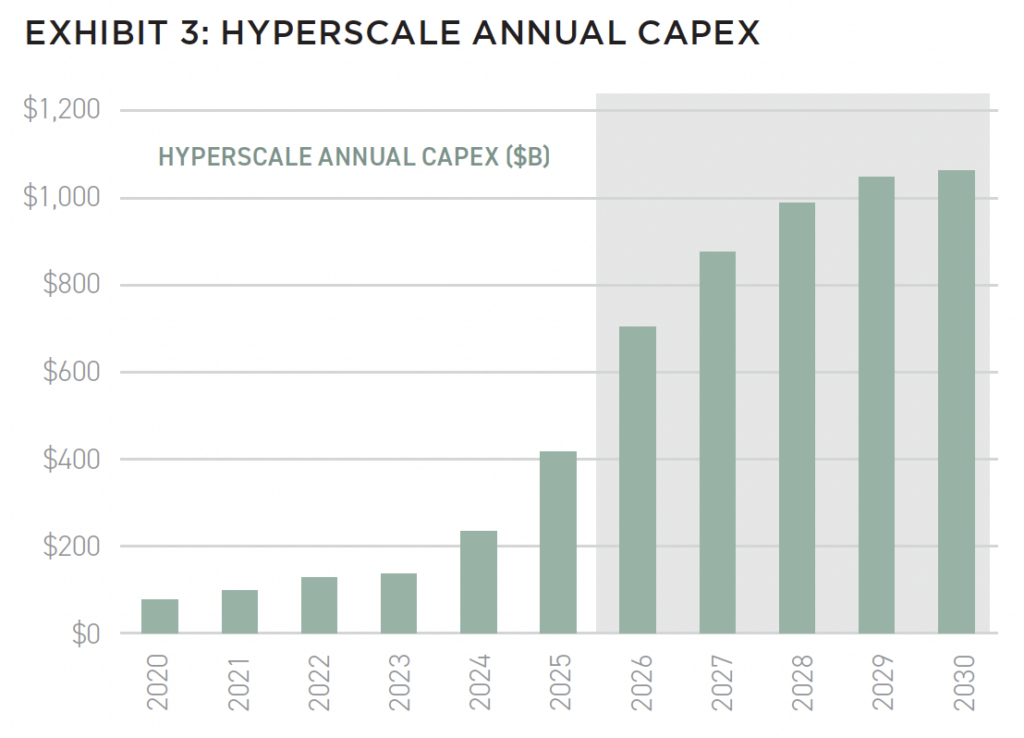
Data center demand has increased significantly as the need to process, store, and distribute data continues to compound. The five largest hyperscale companies are expected to spend over $700 billion on capital expenditures in 2026, well above last year’s record, with roughly three-quarters directed to AI infrastructure (Exhibit 3). Notably, these estimates exclude significant capex from neocloud companies.[v] Construction spending on data centers reached $50 billion for the first time in April 2026, exceeding spending on public transit infrastructure—a category that includes airport facilities, marine terminals, and mass transit—for the first time on record.[vi]
While data centers are often classified separately from traditional industrial product, the build-out generates substantial adjacent demand for warehouse space to support their construction, critical inputs, and ongoing operations. In addition, the industrial sector has demand from the broader infrastructure investment in grid modernization, transmission, and energy generation, all of which require domestic manufacturing capacity and logistics networks.
Increased Defense Spending
Policymakers have increased military spending given elevated global conflict and geopolitical concerns. The House recently passed a $1.15 trillion bill for defense funding in fiscal year 2027, which would mark a roughly $230 billion increase year-over-year.[vii] US military spending is part of a broader global context, with many NATO countries recently pledging to spend 5% of GDP, often provided by US aerospace and defense companies.[viii]
Military investment is intertwined with the AI and manufacturing build-out, competing for many of the same resources and supporting supply chains, while also servings as a direct source of industrial demand. Defense-related demand also tends to be long-term in nature as security requirements, specialized improvements, and other factors make it difficult for tenants to relocate.
HIGHER RESOURCE INTENSITY AND POWER CONSTRAINTS
A system with embedded redundancies for resiliency and an expanded set of users creates intense demand for a fixed amount of resources and at a higher cost. For example, copper—a key industrial metal input—prices have increased nearly 120% since the pre-pandemic period while power transformers and power regulator prices are up about 75% over the same time (Exhibit 4).[ix]
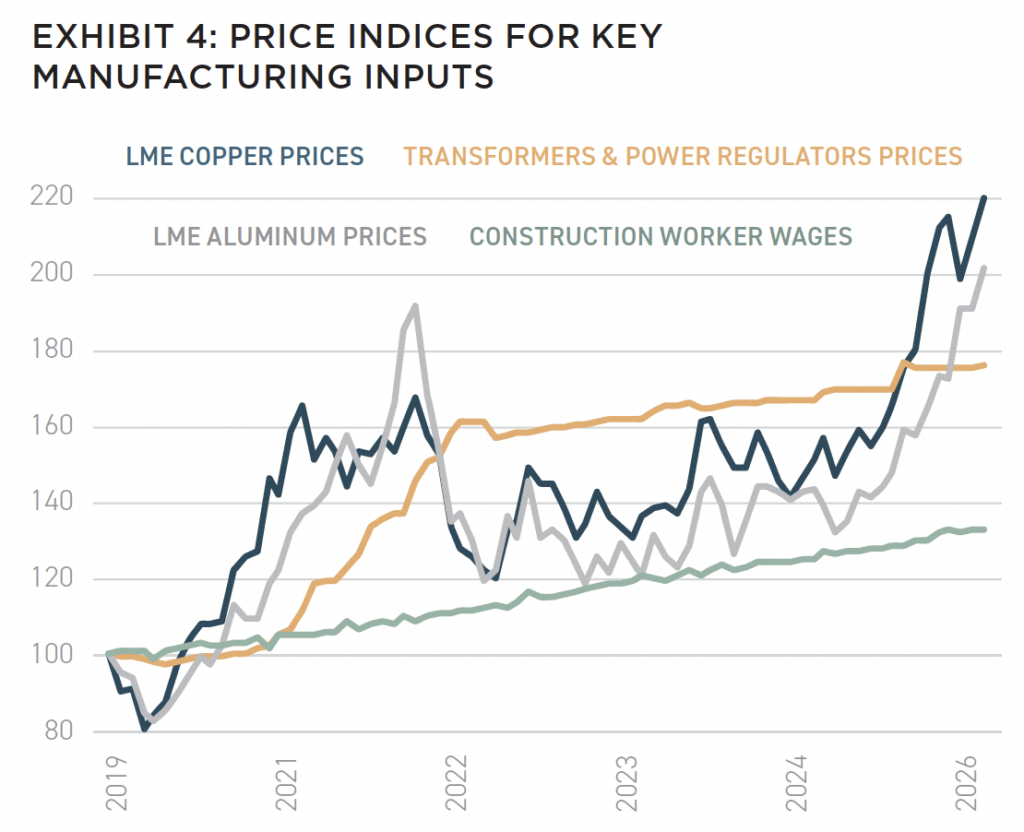
Construction workers’ wages have increased over 30% with higher growth rates for certain labor specialties too. There have also been costly project delays. As an example, lead times for heavy power equipment are now often quoted at three years and longer.[x] These factors coincide with evolving trade policy which has raised the cost of certain goods and introduced periods of elevated volatility and uncertainty.
In addition, data centers, manufacturing facilities, and other users have substantially increased the demand for power, competing for capacity with industrial properties. This landscape is met by stretched and aged infrastructure, with the average US electric grid approximately 40 years old. According to the International Energy Agency (IEA), “the next five years will add on average 50% more electricity demand per year than over the past decade” to support a broad range of end-users spanning governments, businesses, and consumers that will require significant additional capacity.[xi]
A “TIPPING POINT” IN THE RECOVERY
These forces have added expanded structural demand for industrial real estate while simultaneously restraining supply given significant competition for resources, tariffs, and a prolonged period of higher interest rates.
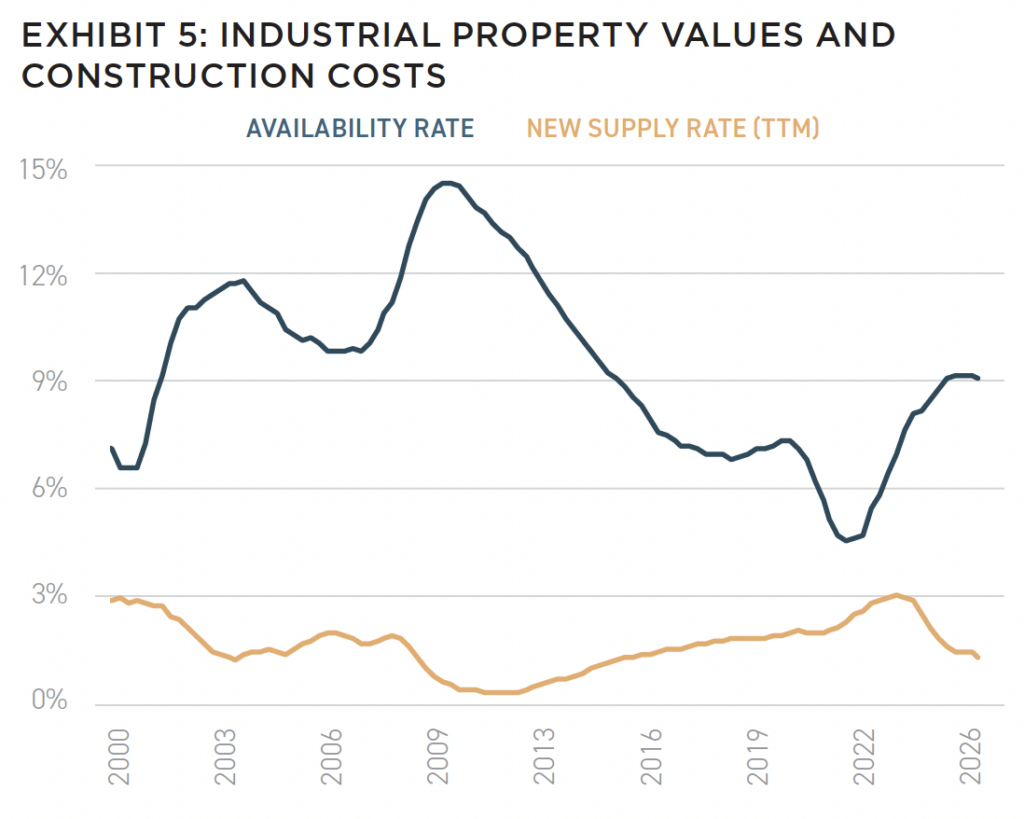
This provides pricing support to the value of existing assets from a replacement cost perspective, particularly those in power and land-constrained locations, while sponsors who can achieve favorable development economics benefit from a decelerating supply pipeline (Exhibit 5).
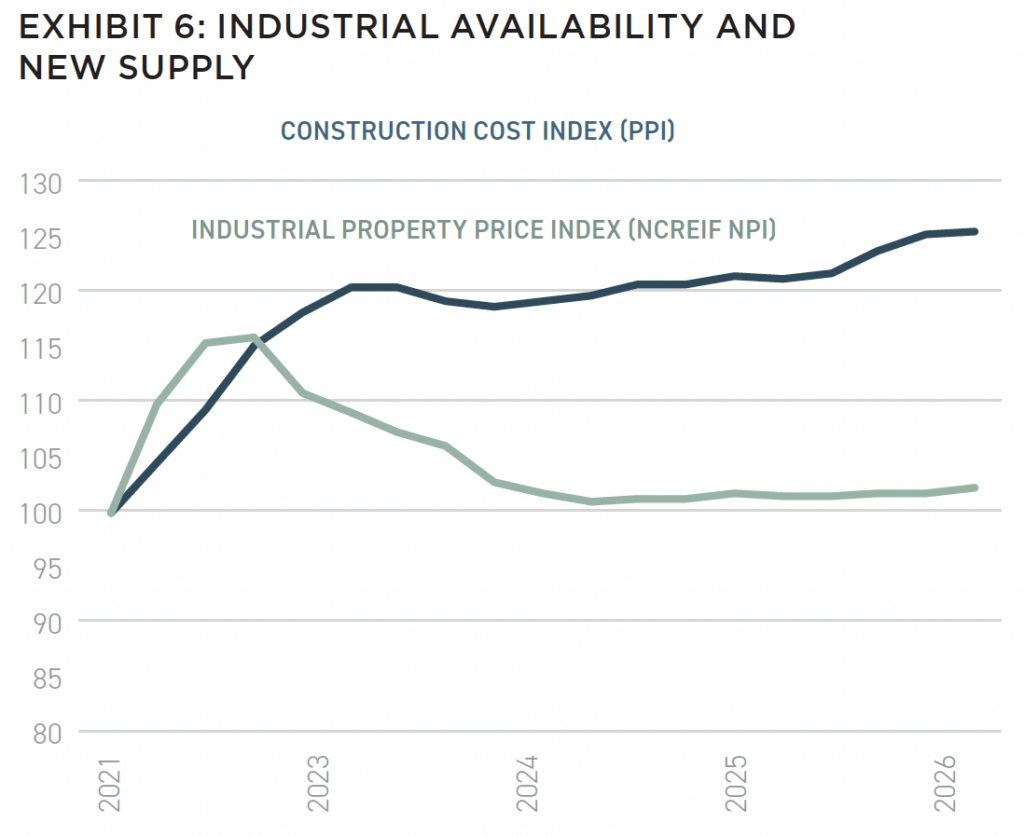
The industrial sector’s fundamentals reflect these dynamics as availability decreased 10 bps to 9.2% in the second quarter (Exhibit 6).[xii]
This marked the first quarterly decline since 2022 and was supported by lower industrial completion rates with construction starts down about 55% from the peak in 2023.[xiii]
Net absorption accelerated with third-party logistics providers, retail and wholesale trade users, and manufacturers expanding their supply chains and production capacity representing nearly two thirds of total leasing in 2026, an occupier mix that reflects the forces of reindustrialization.[xiv]
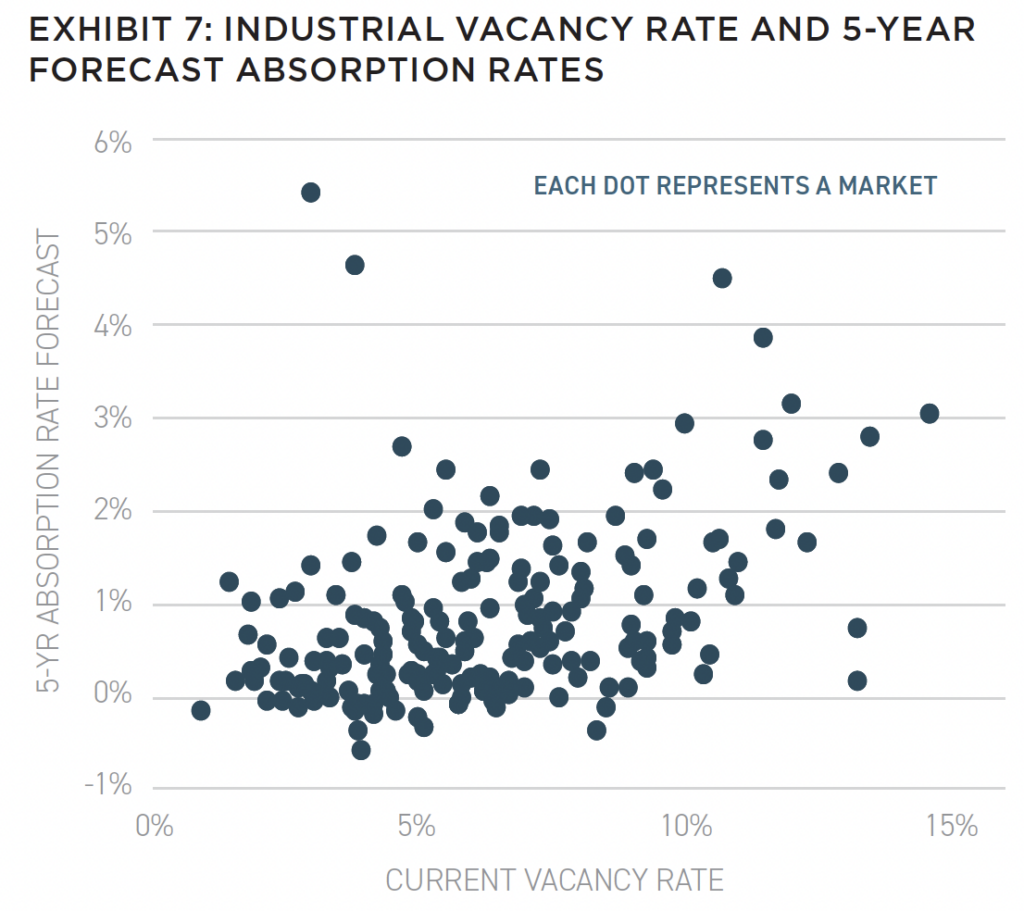
The sector’s fundamentals have broadened, but absorption has gravitated to product types set to support the reindustrialized economy (Exhibit 7).
According to CBRE, occupier demand has shifted away from older vintage assets with lower clear heights to newer properties with the infrastructure to support advanced technology integration. In addition, tenant needs for domestic manufacturing, defense, AI, and infrastructure plans spurred demand for larger format industrial space. For example, properties with 500,000+ square feet accounted for about 26% of all leases signed in the first half of the year, up from 16% a year ago and about 23% from 2022 through 2024 on average.[xv]
There are also important considerations when the industrial sector is viewed through the lens of port markets, regional manufacturing and distribution hubs, and fulfillment centers with differentiated demand drivers.
Port markets have been more sensitive to trade policy and the current environment favors partners with lower tariff rates with economic and geopolitical alignment. For example, US tariffs on Chinese imports are nearly 22%, well above the estimated 7% weighted average rate for all imports.[xvi] This has had a notable impact on West Coast markets such as the Inland Empire with US-China imports down about 40% since “Liberation Day.”[xvii]
As trade policies aim to promote domestic production, industrial demand has increased in markets leading the manufacturing expansion with Phoenix and Columbus capturing increased leasing activity from significant semiconductor manufacturing investment.
Interior markets—such as Dallas—and “last mile” warehouses have been more insulated from tariffs, but demand fundamentals are set by end-consumer consumption, expanded e-commerce adoption, and other domestic sources of demand that have been resilient.
AN EXPANDED BUT DIFFERENTIATED OPPORTUNITY SET
The reindustrialized US economy is a significant force providing added layers of demand, but the benefits are not likely to be evenly dispersed. Assets with access to power, infrastructure connectivity, and formats suited for modern needs—such as clear heights and technology integration—are expected to lead absorption. Similarly, micro-locations with a posture toward domestic and nearshore manufacturing, AI and infrastructure investment, defense spending, and durable consumer consumption provide a strong foundation to capture increased demand.
+ ISSUE 22

NOTE FROM THE EDITOR: ISSUE #22
AFIRE 2026 Mid-Year Pulse Survey Report (P. 6)
Market Mitigation: American Economic Power Translates into CRE Opportunity (P. 18)
Real Estate in the Next Cycle: A New Generation of Investment Ideas for the Built Environment (P. 26)
The Narrow Gate: Who Actually Raises Foreign Capital for US Real Estate (P. 36)
Middle East Institutional Capital and US Real Estate: Are They Still Friends?(P. 42)
Arbitrage in Plain Sight: How “Bucketized” Capital and Lost Skills Leave Billions on the Table (P. 52)
Real Estate Credit Reimagined: Private Credit and Debt Capital Markets (P. 60)
(Re-)Industrial Demand Drivers: From Efficiency to Resiliency (P. 66)
Zombie Funds or Patient Capital: Age Alone Cannot Distinguish a Stagnant Fund from a Disciplined Vehicle (P. 72)
Upending Underwriting: Fat Tail Risks in North American Office Investments (P. 76)
The Economics of Place: Quantifying the Mixed-Use Premium (P. 82)
The Overlooked Gateway: Opportunity Zones and Cross-Border Capital (P. 88)
Opportunities in Pro-Housing Policy Shifts: Investing in Markets with Public Policy Support (P. 94)
Rethinking Luxury Hospitality: Transforming Complexity into Long-Term Value (P. 100)
Before the Next Decision: Field Work to Organizational Capability (P. 108)
The Maturity Wall Is Already Here: Why the Headline CMBS Delinquency Rate Understat
+ ALL ARTICLES
+ ARCHIVE
+ LEADERSHIP
+ POLICIES
+ GUIDELINES
+ CONTACT
+ MEDIA KIT (PDF)
DISCLAIMER
The publisher of Summit is not engaged in providing tax, accounting, or legal advice through this publication. No content published in Summit is to be construed as a recommendation to buy or sell any asset. Some information included in Summit has been obtained from third-party sources considered to be reliable, though the publisher is not responsible for guaranteeing the accuracy of third-party information. The opinions expressed in Summit are those of its respective contributors and sources and do not necessarily reflect those of the publisher.
NOTES
[i] Source: BEA, JPMorgan, Manhattan District History, Hoover Archives, NYT, WSJ, and others. As of February 2026
[ii] Source: IMF. Ahn, Tan. “Supply Chain Diversification and Resilience.” As of May 2025.
[iii] Source: CBRE EA. As of June 2026.
[iv] Source: Newmark. As of March 2026.
[v] Includes Amazon, Google, Meta, Microsoft, and Oracle. Source: Bloomberg. June 2026.
[vi] Source: Census Bureau. As of May 2026.
[vii] Source: NPR. As of July 22, 2026.
[viii] Source: Reuters. As of May 2026.
[ix] Price and wage changes, December 2019 to May 2026. Source: Bloomberg, Federal Reserve, Bureau of Labor Statistics (BLS), London Metal Exchange (LME). As of May 2026.
[x] Source: Sightline Climate, Bloomberg, Tech Insider, Wood Mackenzie. As of April and May 2026.
[xi] Source: International Energy Agency (IEA), Electricity 2026, February 2026
[xii] Source: CBRE EA. As of Q2 2026.
[xiii] Source: CoStar. As of Q2 2026.
[xiv] Source: CBRE. As of Q2 2026.
[xv] Source: JLL. As of Q2 2026.
[xvi] Source: Bloomberg. As of August 2026.
[xvii] Source: Census Bureau. As of May 2026.
ABOUT THE AUTHOR
Lincoln Janes, CFA, is Senior Director, US Research for Barings Real Estate.