
The latest joint report from the Praedium Group and SitusAMC looks at rising fiscal pressures on state and local governments, including large-scale changes accelerated by the pandemic.
Throughout the stages of the past economic cycle, Praedium and SitusAMC Insights have published a series of joint reports, most recently in 2018, analyzing the fiscal pressures on state governments and how the resulting responses to those fiscal pressures may affect demographic patterns, economic growth trajectories and commercial real estate demand.
The increasing burden of state and local taxes required to face the mounting level of unfunded pension liabilities and other committed liabilities could drive widening differentials in local business and living costs, alter regional growth patterns and thereby affect CRE demand. The COVID-19 pandemic and its impact on the economy and local tax collections is exacerbating this pre-existing issue.
While other market attributes and specific local real estate supply and demand factors will also play a significant role in property market fundamentals, the over-arching trends driven by stressed municipal factors could be a mega-theme for real estate in coming years.
HIGHLIGHTING THE PENSION FUNDING ISSUE
Pension funding in the US has encountered a number of issues in recent years; an aging baby boomer population, substantial benefit promises, and optimistic investment return assumptions have all contributed to the current situation. Furthermore, just as the GFC intensified existing pension funding issues, the economic fallout of COVID-19 will further stress pension funding across the country. Rather than addressing this amid the longest economic expansion in US history, many state and local governments have neglected this growing problem, continuing to “kick the can down the road.”
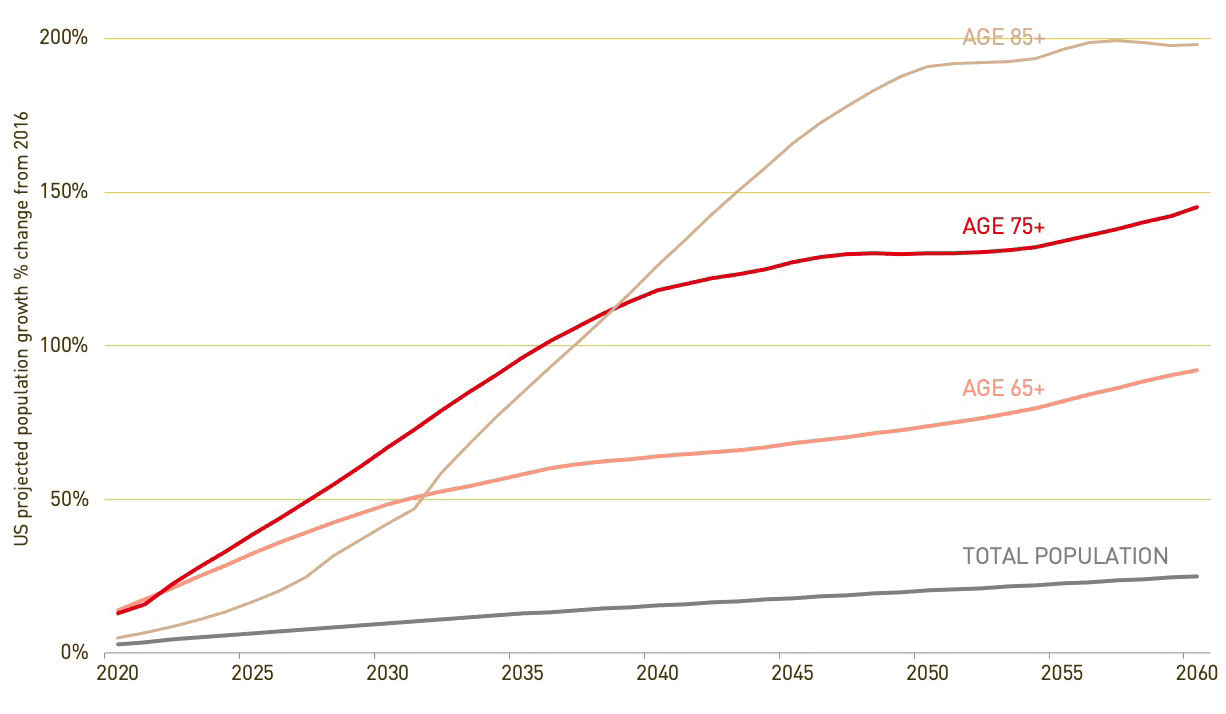
Demographic trends are one of the main threats facing pension funds, as a significant risk is the aging of the baby boomer population. While the Census Bureau projects the total US population to grow 25% by 2060, the older cohorts are expected to see substantially larger gains. The 65+ population is projected to rise more than 90% over that time, far above the total population pace, while the 85+ population is expected to see a staggering gain of nearly 200%. This presents a considerable liability as growing obligations to older age groups will outweigh shrinking contributions from younger generations. Restricted immigration serves to slow the growth of younger population cohorts, exacerbating this trend.
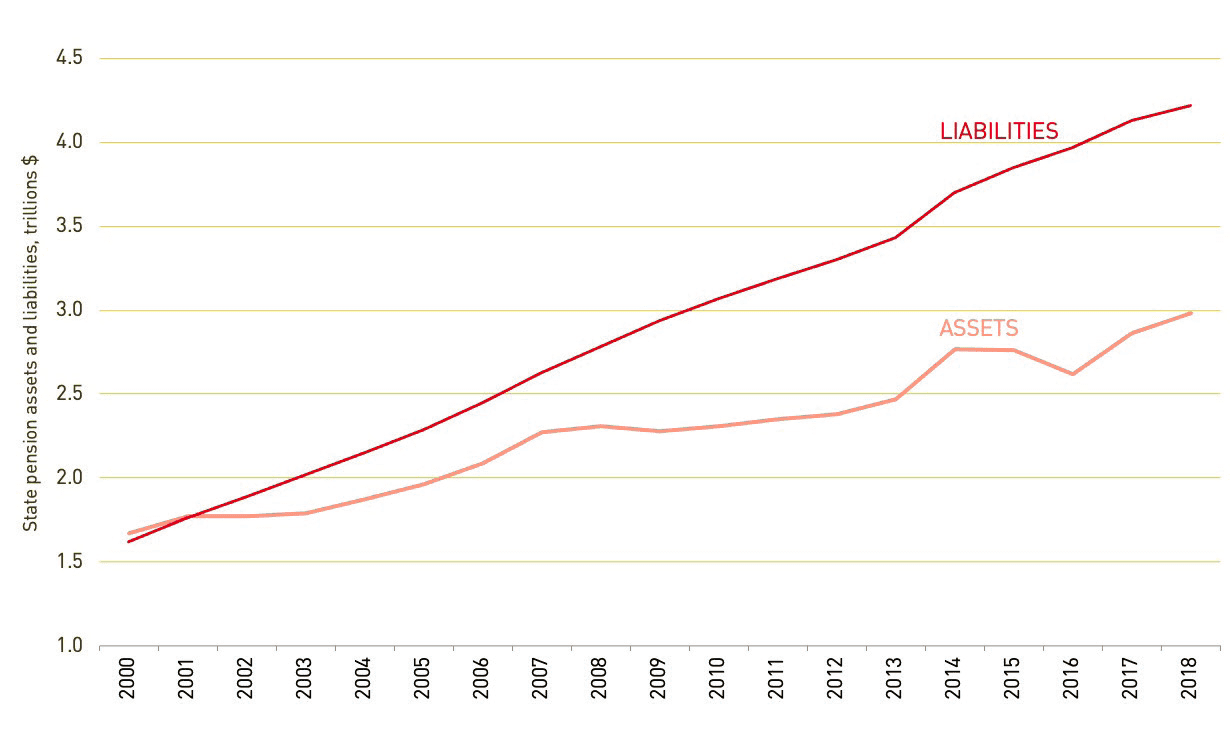
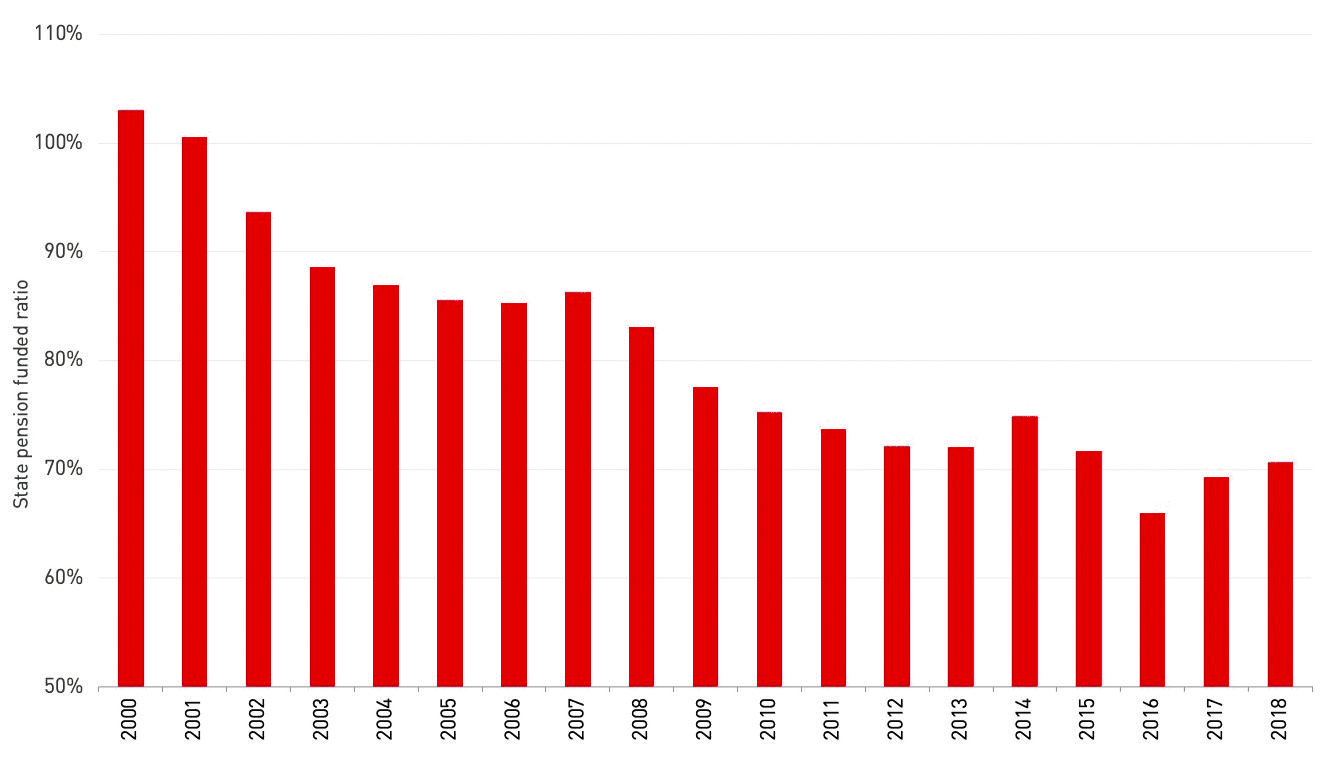
State pension liabilities have seen a persistent rise since 2000, growing over 160% by 2018. Meanwhile, assets have seen choppier growth, rising less than half as much over that same time. This bumpiness has allowed their gap to widen in the aftermath of the financial crisis, as assets have contracted in three of the past ten years, leading to average growth of 2.7% per annum over that time, compared to 4.3% yearly gains in liabilities. State pension funded ratios stood at a healthy 103.1% in 2000, however have collectively fallen in all but three years since. State ratios slid to 86.3% by 2007, still above the widely recommended 80% minimum, but soon fell below that threshold in the aftermath of the financial crisis and have continued to decline. Ratios actually improved slightly in 2018 as liabilities saw their smallest gain since 2000, but this only lifted them to 70.6%. Despite the longest economic expansion in US history, state pension funded ratios have deteriorated and remain well below pre-recession levels. Even if further measures are taken to reduce liabilities, funded ratios should continue to slide in the aftermath of COVID-19 as tax revenues dip.
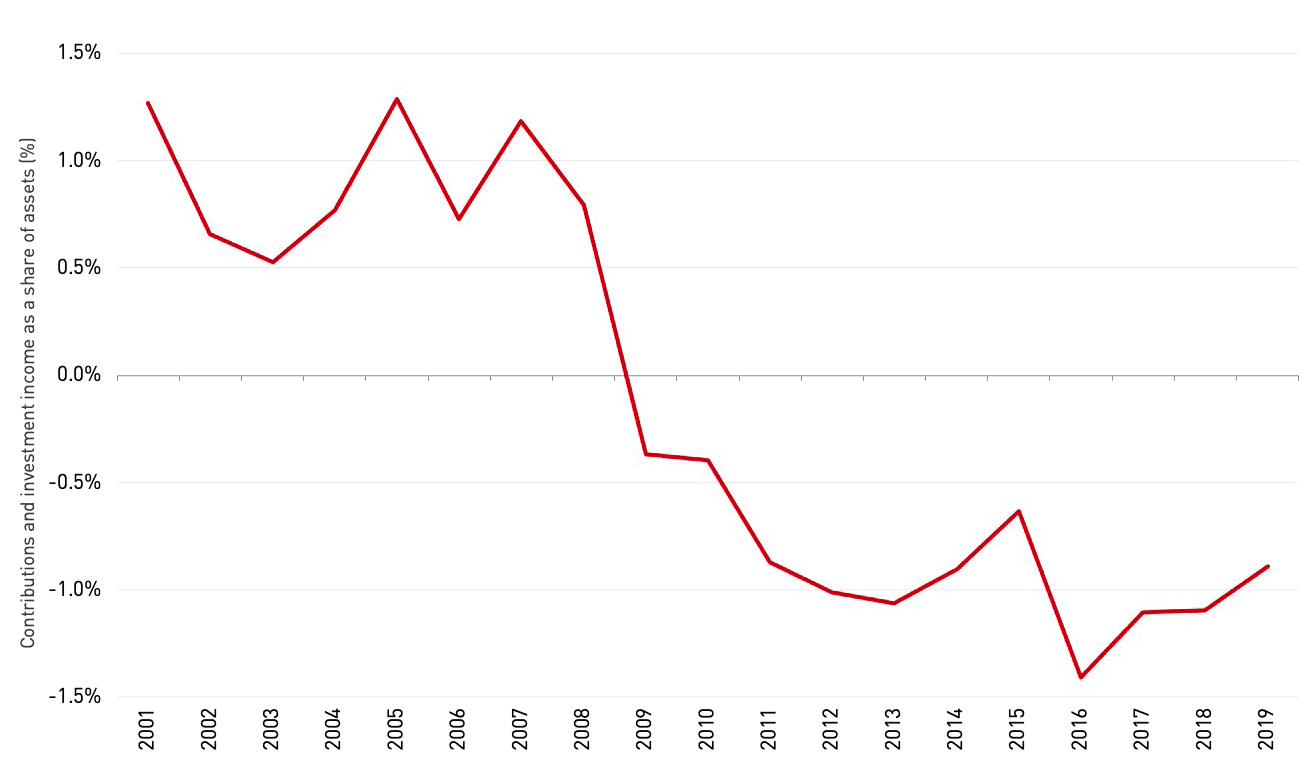
Over the past two decades, actual returns have averaged 6.2% per year, compared to 7.7% assumed, with a similar gap over the past five years. The Center for Retirement Research at Boston College estimated FY2020 returns to measure 1.8%—well below the 7.2% assumed. An analysis of contributions and investment income as a share of assets reveals that pension funds have been forced to liquidate assets every year since the financial crisis in order to fund benefits, at a rate of roughly 1% per annum over the past decade. In addition to being a troublesome long-term trend, during downturns there is an additional risk that assets are potentially being sold at a discount, further eroding pension fund assets.
AN AGING US POPULATION WILL INTENSIFY PENSION PRESSURES
THE GAP BETWEEN STATE PENSION ASSETS AND LIABILITIES HAS WIDENED OVER THE PAST TWO DECADES…
…CAUSING STATE PENSION-FUNDED RATIOS TO SUFFER
Seasonally adjusted state and local tax revenue fell nearly 20% in the second quarter of 2020 following the COVID-19 outbreak, far more severe than its previous worst quarter in Q1 2009 (-13.1%) and not far behind the total drop in the aftermath of the GFC (-26.8%). With revenue sliding below US$325 billion in Q2 2020, it is already at its lowest level in over five years. Third quarter data showed a bounceback, but much of that reflected delayed tax filings resulting from the income tax deadline extension.
It previously took nearly a decade for state and local tax revenue to recover from the pre-financial crisis levels, suggesting lower tax revenue will be a reality for some time. The series of stimulus legislation has helped boost personal income and sustained spending, shielding the hit to incomes from the pandemic somewhat.
Meanwhile, state and local spending has increased in response to pandemic related spending. Looking forward, the potential for impaired tax revenue and higher spending may likely continue to stress state budgets and sour pension funded ratios.
ALSO IN SUMMIT (SPRING 2021)
GREAT LAKES / Tightening the Belts: How are shorthand labels like the “Sun Belt” and the “Rust Belt” shaping investment decisions? Should they?
AFIRE | Gunnar Branson and Benjamin van Loon
SOCIAL ISSUES / The Great Real Estate Reset: A data-driven initiative to remake how and what we build.
Brookings | Christopher Coes, Jennifer S. Vey, and Tracy Hadden Loh
SOCIAL ISSUES / Confronting the Myth: The events of the past year have driven businesses to confront racial inequity, but some still shy away from the challenges needed to make real progress.
Alfred Dewitt Ard Consulting | Shumeca Pickett
INDUSTRY OUTLOOK / CRE Prospects Post-COVID-19: How is commercial real estate set to perform in the post-COVID world?
Aegon Asset Management | Martha Peyton
HOSPITALITY / Time to Check In: If history is a guide, the time to invest in hotels is when things look bleak. This appears to be one of those times.
Barings Real Estate | Jim O’Shaughnessy
HOSPITALITY / Hoteling 2.0: The pandemic has impacted the hospitality, but a growing wave of non-traditional investors has shown heightened interest in the evolving industry.
JLL Hotels & Hospitality Group | Gilda Perez-Alvarado
RESIDENTIAL / Safe as Houses?: The future of residential investments is all about demographics—and the forces behind them.
American Realty Advisors | Sabrina Unger
RESIDENTIAL / Housing for Goldilocks : The pandemic highlights the advantages of single-family and appears to have accelerated migration to less dense, more affordable areas.
GTIS | Eliot Heher and Robert Sun
DATA CENTERS / Data Centers, Stage Center: Data center investments have proven resilient in periods of volatility—and they’re only going to become more essential and important into the future.
Principal Real Estate Investors | Bob Wobschall
CLIMATE CHANGE (WHITE PAPER) / Rather Than the Flood: A comprehensive look at climate-induced water disasters and their potential impact on CRE in the US.
New York Life Real Estate Investors | Stewart Rubin and Dakota Firenze
LOGISTICS / Reforging the Supply Chain: The only way to deliver on the service promises of a booming logistics sector requires a complete reimagination of the supply chain.
Stockbridge | David Egan
DEBT AND LEVERAGE / Leveraging Control: Though leverage is an important part of capital funding, it’s important to ask LPs if (and how) they should take control of their real estate leverage.
RCLCO Fund Advisors | William Maher and Ben Maslan
DEVELOPMENT / Recasting Risk and Return: The investment community can have an active role in economic recovery—but it will require recasting the traditional risk/return framework.
Standard REI | Shubrhra Jha
CORPORATE TRANSPARENCY ACT / Transparency Rules: Non-US-based investors face the disclosure regime of the Corporate Transparency Act. What do you need to know?
Pillsbury | Andrew Weiner
PENSIONS (WHITE PAPER) / Rising Pressures: The latest joint, in-depth report from Praedium and SitusAMC looks at rising fiscal pressures on state and local governments.
Praedium Group and SitusAMC Insights | Russell Appel, Peter Muoio, and Cory Loviglio | SitusAMC Insights
TALENT AND HR / Plugging the Skills Gap: Several trends are forcing change in the global commercial real estate industry, driving demand for new skills. How is the industry responding?
Sheffield Haworth | Max Shepherd
ESG / Operationalizing the Sustainability Agenda: During a time of unprecedented disruption, how should businesses approach the “new metrics” ESG of performance?
AccountAbility | Sunil A. Misser
EXHIBIT 4: AVERAGE RETURNS HAVE LAGGED ASSUMED RETURNS FOR YEARS
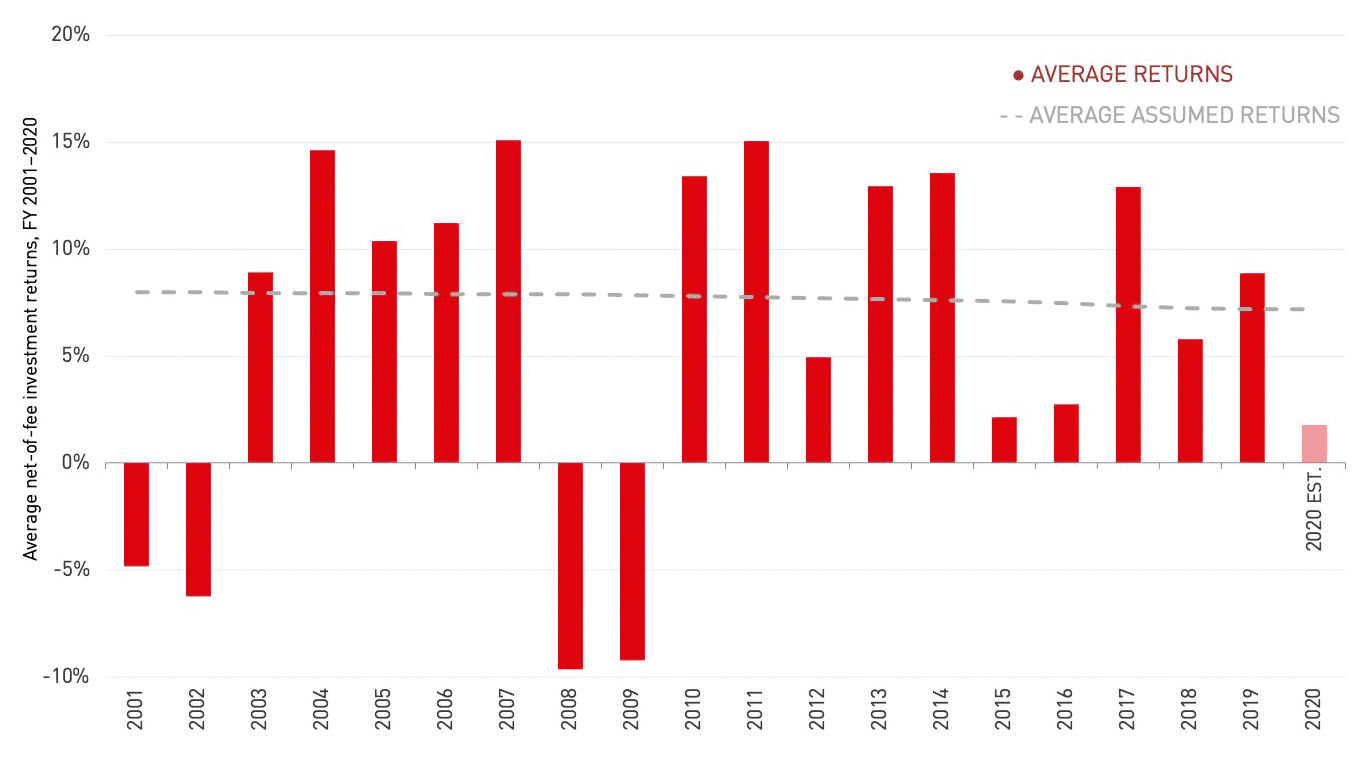
EXHIBIT 5: PENSION FUNDS HAVE LIQUIDATED ASSETS SINCE THE GFC
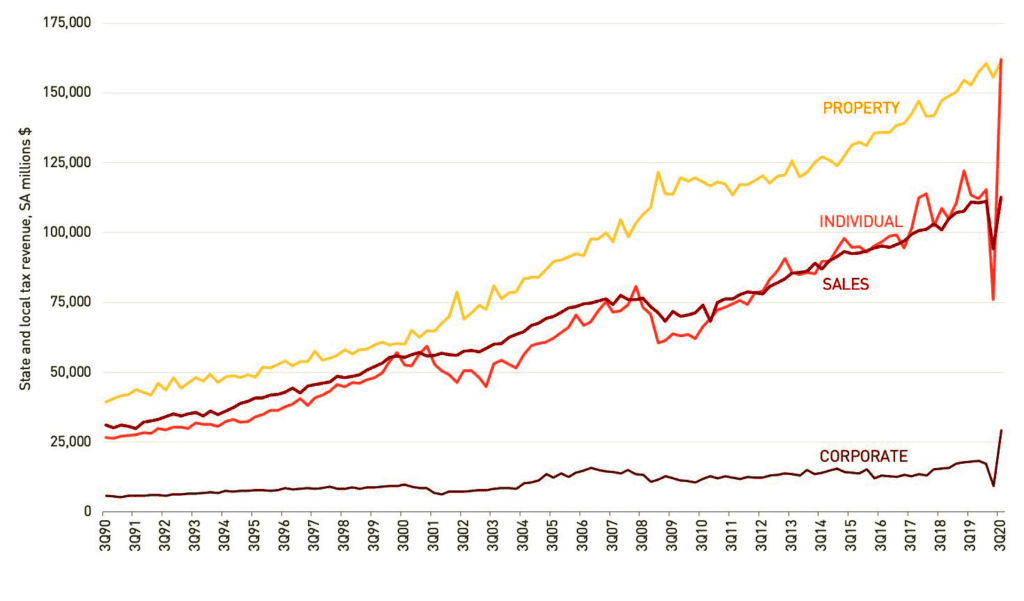
Corporate taxes, though representing the smallest portion of total tax revenue, saw the most severe drop of nearly 40% in Q2 2020, easily their worst quarter on record. Individual income and sales tax revenue fell 30% and 15% respectively, more than double their previous worst quarterly drops. Property tax revenue fell 5.3%. The bounce-back in the third quarter not only reflected delayed filings but also the impact of rising equity prices, especially for tech stock, driving capital gains income.
Though property taxes have been steadier than other segments over time, the pernicious effect of deteriorating finances, accelerating relocation, and diminished services could erode the property tax bases of the hardest hit locales over time, as commercial properties are re-appraised.
EXHIBIT 6: STATE AND LOCAL TAX REVENUES BOUNCED BACK IN Q3 2020 AFTER A 17% QUARTERLY DROP, THOUGH THIS WAS BOOSTED BY EXTENDED TAX DEADLINES
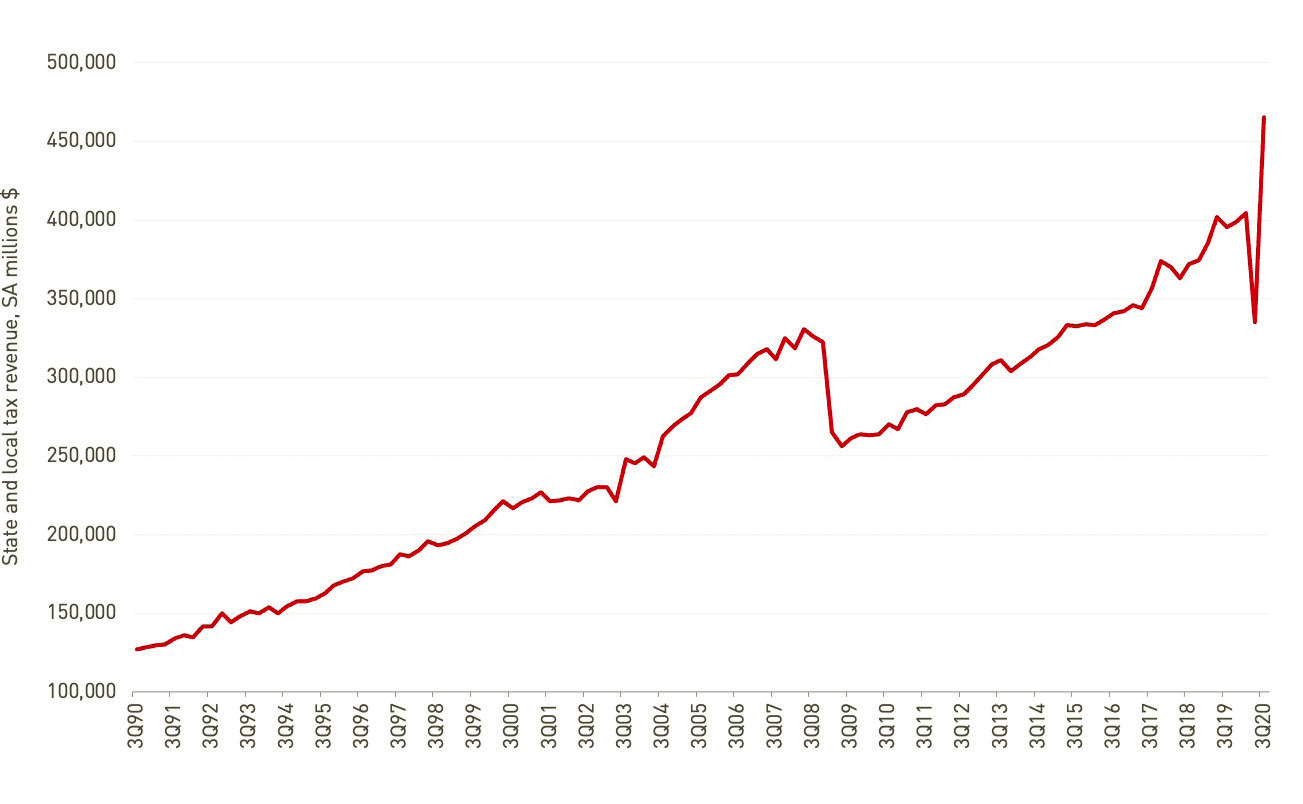
EXHIBIT 7: INDIVIDUAL AND CORPORATE INCOME TAX REVENUE LED THE Q3 2020 REBOUND AS MANY TAX DEADLINES WERE PUSHED FROM Q2 2020
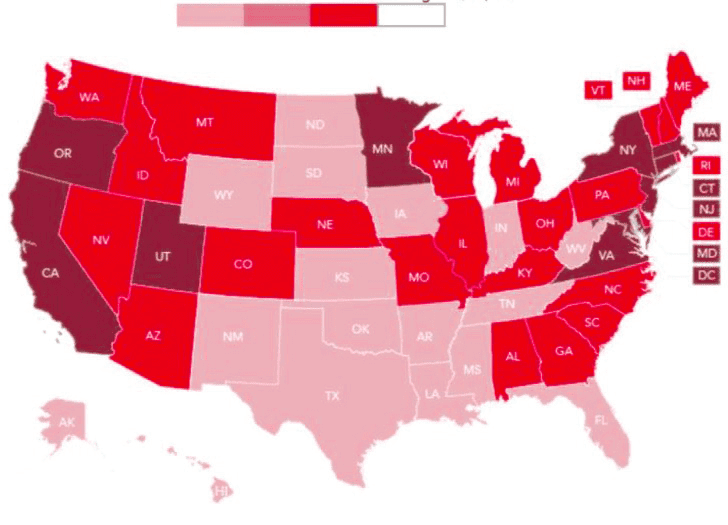
Another issue at the forefront of state and local tax policy is the reduction of state and local tax (SALT) deductions, a change that could affect tax burdens and influence future domestic migration. Beginning in 2018, the Tax Cuts and Jobs Act (TCJA) capped SALT deductions at $10,000—a significant development that would add to taxpayer burdens in already high-tax states. In the aftermath of the TCJA, the Tax Policy Center estimates that the SALT revenue cost fell from $100.9 billion in 2017 to $21.2 billion by 2019.[1] The percentage of taxpayers claiming the deduction in 2017, immediately prior to the change, ranged from a low of 17% in West Virginia to a high 47% in Maryland. As portrayed in the map in Exhibit 8, the states with the highest shares claiming the deduction were found primarily in high-tax coastal states. Without the SALT deduction, taxpayers in these states were hit with disproportionately higher taxes. It could take some time for the impact to be felt in migration if overtaxed residents flee such conditions, and many of these states already struggled with population growth, though many of these states did indeed see poor domestic migration rates in 2019. Though some may expect the Biden administration to repeal the SALT deduction, to date he has been relatively quiet on this matter.
EXHIBIT 8: HIGH-TAX STATES SAW THE HIGHEST SHARES OF SALT DEDUCTIONS CLAIMED IN 2017
PENSION FUNDING BY STATE
In our previous analysis in 2018, half of the states improved their pension funded ratios between 2010 and 2015.[2] Most recently, between 2015 and 2018, just 19 states improved their funded ratios, a concerning trend considering the US economy was firmly in economic expansion over that time. Three states improved their ratios by more than 5% over this most recent span; Washington’s 6.8% gain pushed it above the 90% threshold and West Virginia’s 5.3% gain pushed it above the 80% threshold, though Kentucky’s nation-best 7.1% improvement still leaves it at just 45% funded. South Dakota is the only state at 100%, though it did slip between 2015-18. Alternately, six states saw their funded ratios slide by more than 5% over that time; North Carolina (-6.8%), Oregon (-9.8%), and Florida (-6.7%) remain at or above the 80% threshold, though drops in North Dakota (-5.2%) and New Mexico (-9.6%) pulled them below 70%, and Hawaii tumbled to just 56% after a 7% decline. Since the latest available data goes through 2018, we can expect many states to see their funded ratios slide perilously further once 2020 is accounted for.
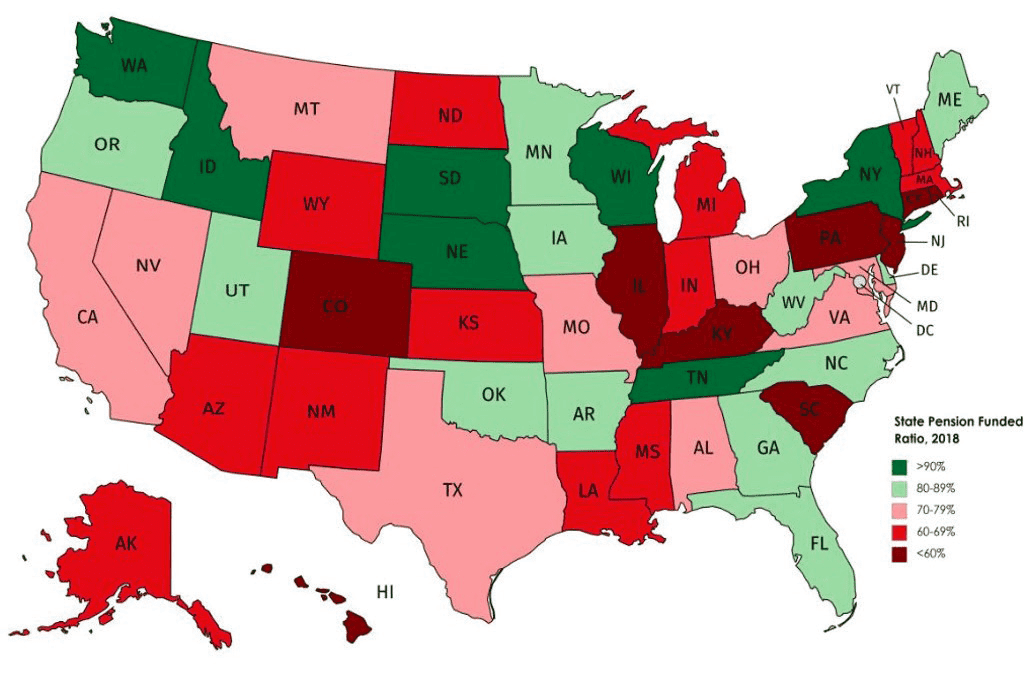
The pension funding landscape by state did not change drastically between 2015 and 2018. Only eighteen states had pension funded ratios greater than the widely recommended 80% in 2018—just one more than in 2015 and only two more than in 2010 despite the economic growth seen over that time. South Dakota’s ratio has dipped since 2015 but stands as the only state with a 100% funded ratio, with only six others north of 90%. At the very least, the consequences may hamstring future growth, particularly if they are addressed with harsher tax conditions, reductions in services, benefit cuts, or higher contributions that discourage future economic and demographic gains. More states may take steps such as legalizing marijuana or gambling to help fund shortfalls in the coming years, but these alone are unlikely to fill such large gaps and restore pension funding levels, especially following the dramatic damage to budgets that ensued from the COVID-19 pandemic.
EXHIBIT 9: THE MAJORITY OF STATE PENSION FUNDING GAPS REMAIN UNDERFUNDED, WITH MANY WORSENING SINCE 2015
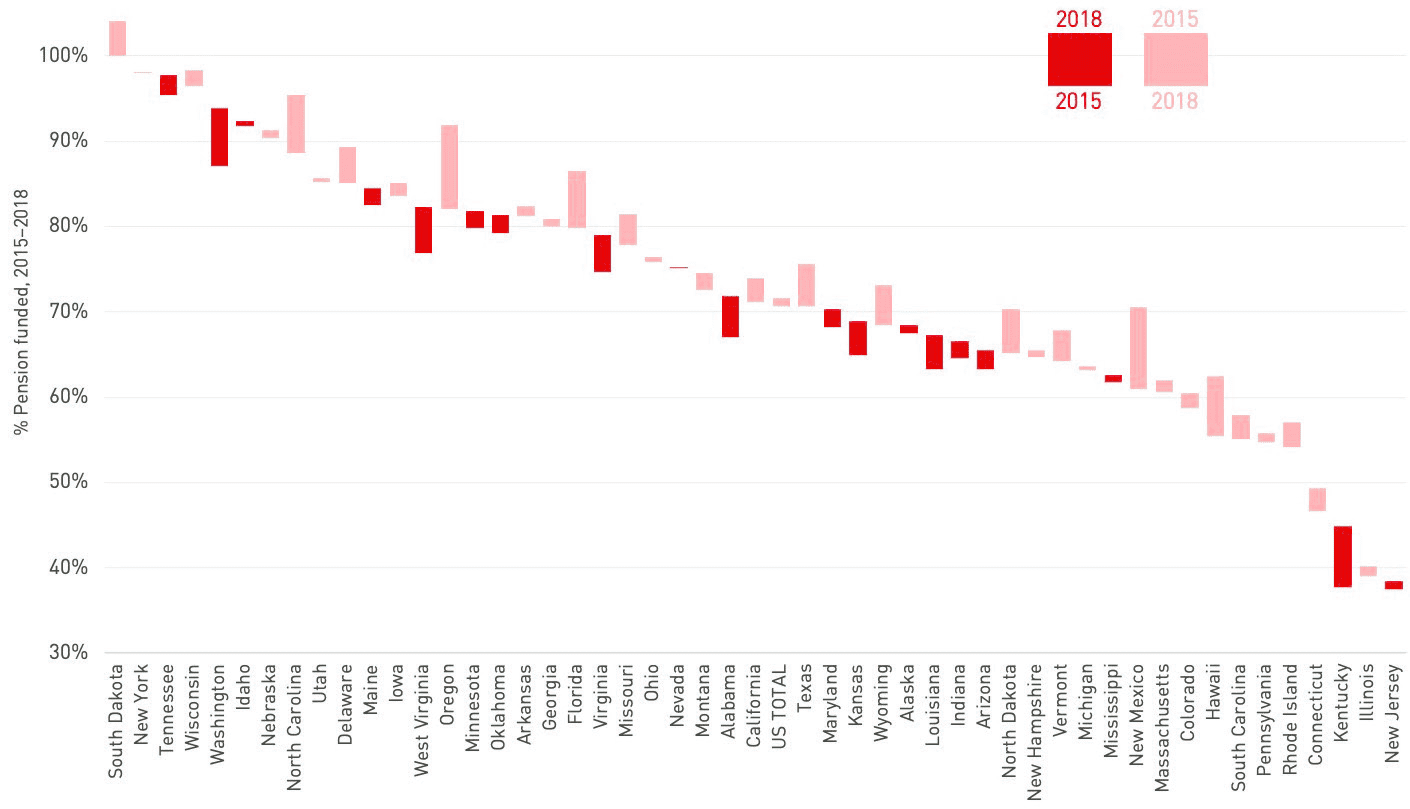
EXHIBIT 10: AS OF 2018, ONLY 18 US STATES STILL HAVE PENSION FUNDED RATIOS ABOVE 80%
LEGAL CONFRONTATIONS
Many pension funding situations may result in legal confrontations, as states scramble to fill funding gaps, and we have already seen battles begin to take place. Kentucky’s Supreme Court dismissed a lawsuit over mismanagement of pension funds in 2020, but also noted that the plaintiffs are fully entitled to fixed payments regardless of the pension system’s financial stability. The Oregon Supreme Court also upheld amendments to the state’s Public Employee Retirement System passed by lawmakers in 2019 that altered benefits by making payment redistributions and capping salaries used to calculate benefits. However, similar to Kentucky, the decision protects benefits earned on service already rendered.
Providence is another city facing a critically underfunded pension system, one that is only 26% funded, with obligations exceeding $1.3 billion. In 2012, the city put a freeze on generous cost of living adjustments some that previously led to instances such as a $197,000 pension for a fire chief who retired 20 years earlier with a $63,500 salary. However, Rhode Island’s State Supreme Court ruled against this freeze in 2020, further cementing that previous obligations cannot be altered despite fiscal stress. California also has a long history of protecting pension benefits dating back to the 1950’s under what is known as the “California Rule.” Per this doctrine, public workers are entitled to retirement benefits promised when they start their jobs, and employers may only reduce benefits if they are replaced with something of equal value. In 2020, the California Supreme Court banned “pension spiking,” the practice of artificially inflating earnings in a worker’s final year by cashing out paid leave and running up overtime. However, they importantly upheld the California Rule yet again in this lawsuit, noting specifically that pension provisions could only be changed “for the constitutionally permissible purpose of closing loopholes and preventing abuse,” which does not cover expensive promises made by previous administrations.
While legal outcomes may vary from state to state, these cases suggest some may be able to alter plans to reduce future liabilities, but the existing benefits owed will be difficult to touch. This could provide some relief to a situation rapidly spiraling out of control, but does not leave states and municipalities off the hook. Since the outcomes could vary by state, those that are barred from making meaningful changes to pensions will face difficult fiscal situations, while states that gain more leeway may also lose their appeal to workers. Either way this is a murky situation rife with uncertainty and will likely not allow states to simply hit a reset button on pension funding.
GEOGRAPHIC IMPLICATIONS
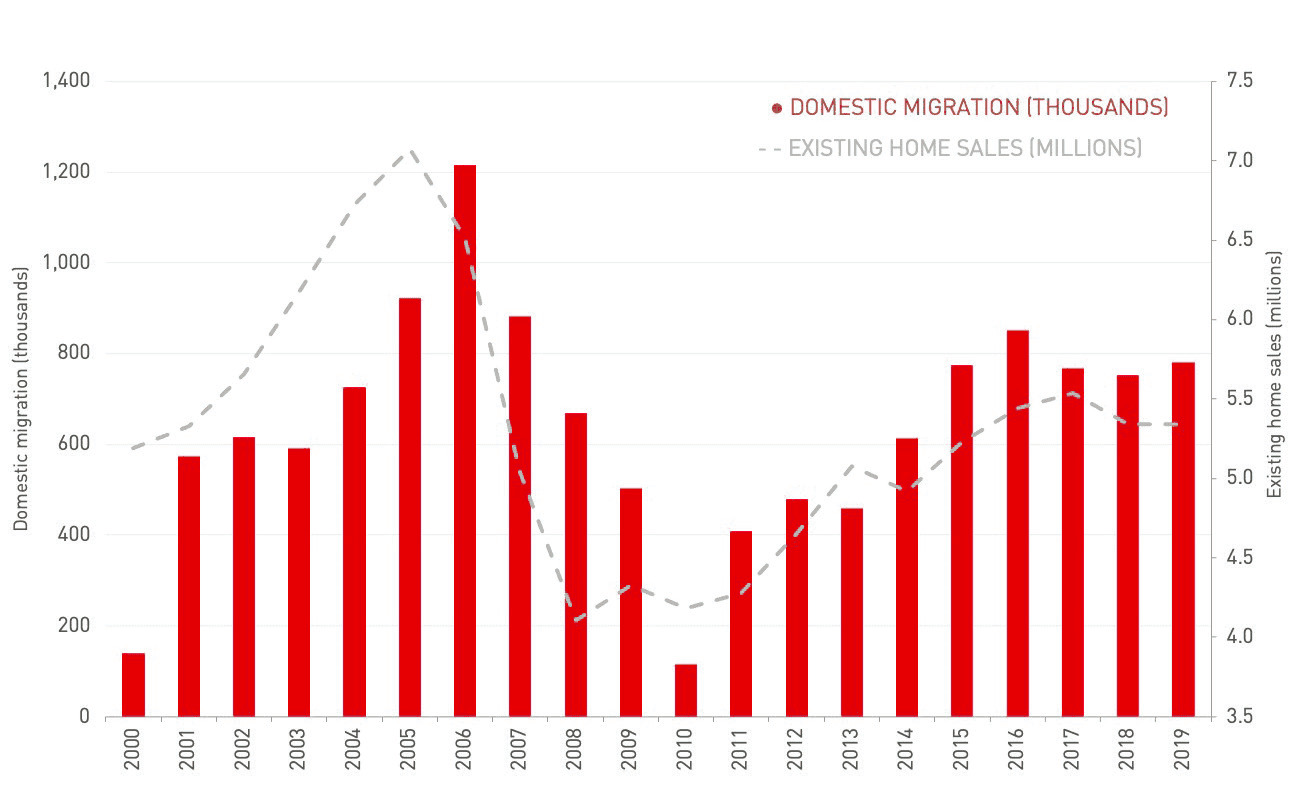
US internal migration rebounded this past decade after falling to historic lows following the housing bust. Though inventory shortages contributed to suboptimal liquidity in the housing market and may have capped some movement in recent years, domestic migration hovered near 800,000 per year between 2015-19. The COVID-19 pandemic could have dramatic short-term and longer-term impacts on domestic migration and living arrangements. Upon the initial onset of the pandemic, domestic travel was severely curtailed but stay-at-home orders also prompted many people to leave small city apartments and double up at larger family and friends’ homes. This presented as a general outflow from cities to suburbs and less dense markets. Longer term, a permanent increase in remote working could enable substantial movement between states.
Anecdotal evidence has suggested that many office workers in expensive cities have fled to the suburbs and cheaper cities. Domestic migration has roughly mirrored trends seen in US home sales, which initially tanked during the COVID-19 outbreak but recently surged to their highest level since 2006. Existing home sales in the US have increased year-to-date as of October 2020—a trend reflected across all regions, ranging from 30% in the Midwest to 20% in the West. Some of these immediate trends may be related to housing supply, as available supply has historically been limited in the West, while the Midwest typically offers more affordable homes. While some movement could be temporary, the prospect of working from home permanently has risen substantially, with major companies like Facebook and Twitter announcing many jobs will remain remote permanently. This potential geographic shift could have an enormous impact on state economies and budgets.
EXHIBIT 11: DOMESTIC MIGRATION FLOWS IMPROVED THIS PAST CYCLE IN THE AFTERMATH OF THE HOUSING BUST
Domestic migration patterns have been fairly consistent in recent years; the Southeast, Northwest, and Southwest regions continue to see the largest gains, while the Northeast, Midwest, and California are struggling with outflows.
Unsurprisingly, expensive, high-tax states such as California, New York, New Jersey, and Connecticut saw some of the most severe outflows, while other hard-hit states such as Illinois, Kansas, and Louisiana have a combination of poor pension funding situations and subpar tax ranks. These migration patterns have a sizeable impact on local economies and their growth potential, and largely reflect the attractiveness of states to workers and businesses. Various quality of life measures contribute to these trends and potential cutbacks to public safety, transit, and sanitation could lead to deteriorated livability. Local tax policy can also play a considerable role and affect the economic viability that attracts or deters both workers and businesses.
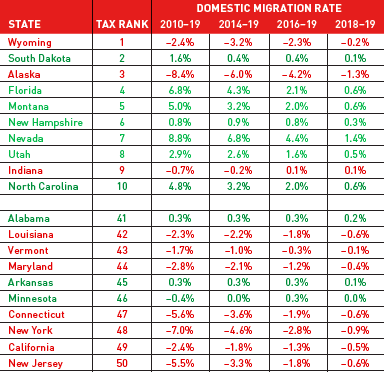
While relative state tax burdens fall short of a direct correlation with domestic migration across all states, a clear pattern emerges when we look at states at either extreme of the tax spectrum. Eight of the ten most burdensome tax states have suffered domestic outflows across various time windows between 2010 and 2019, while the opposite is essentially true for the ten states with the easiest tax environments. This is not to say that state tax policy solely inspires interstate migration, as there are numerous factors including economic opportunity, affordability, and various quality of life measures to consider, but the numbers indicate that the softest tax states tend to benefit from net in-migration while the most burdensome tax states tend to suffer net outflows.
These trends may be further exacerbated by the impact of COVID-19, as expensive, crowded markets become even less appealing to many households. The outbreak of COVID-19 prompted the share of remote workers to double to 62% by April per Gallup Panel data, with half of remote workers preferring to work from home permanently.[3] With major companies such as Twitter and Facebook embracing the expansion of permanent remote work positions, this could become a new reality, potentially enabling more workers to move to cheaper locations.
EXHIBIT 12: NORTHWEST, SOUTHWEST AND SOUTHEAST CONTINUE TO SEE LARGEST GAINS FROM DOMESTIC MIGRATION
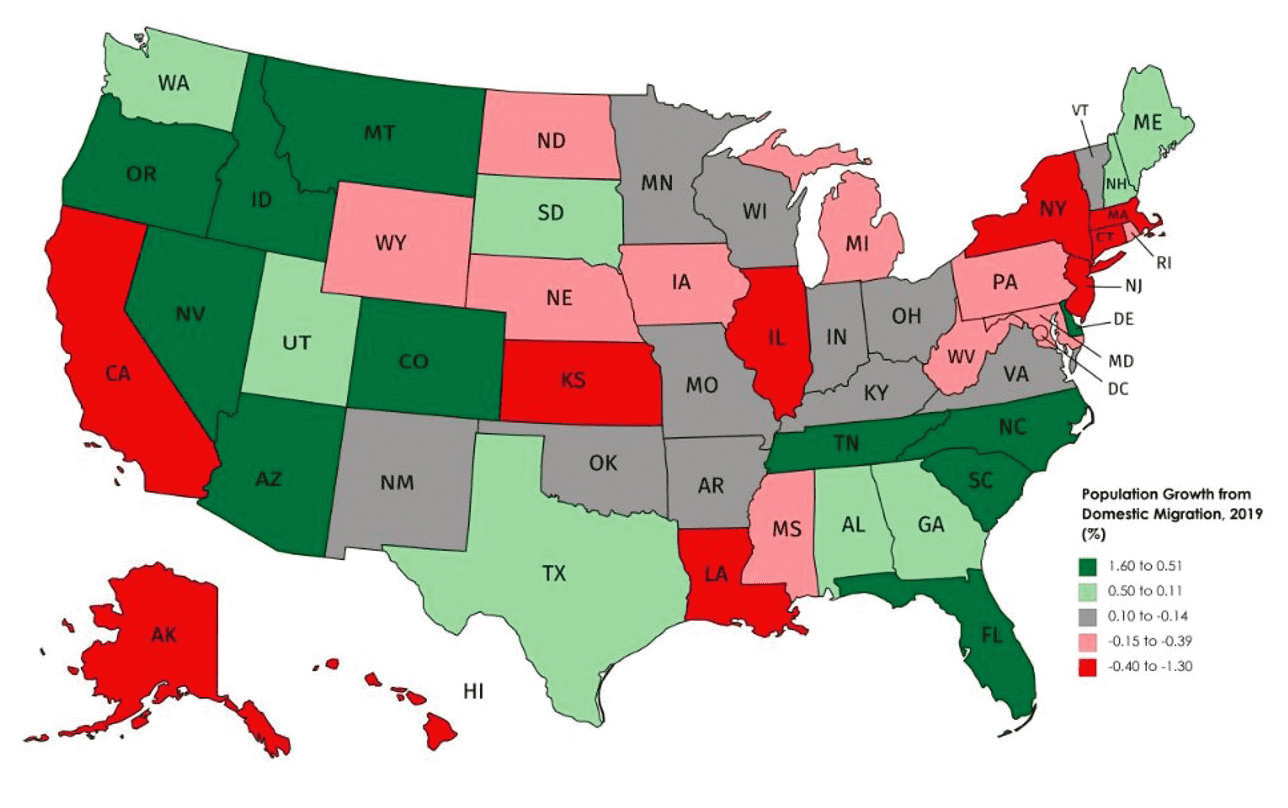
EXHIBIT 13: THE CORRELATION BETWEEN RELATIVE STATE TAX BURDENS AND DOMESTIC MIGRATION FLOWS REMAINS STRONG AT EITHER END OF THE SPECTRUM
Expensive markets already grappled with outflows as high taxes, high costs of living, and tight living spaces made them less appealing to certain workers, and the pandemic has only enhanced these issues. Many individuals were content to accommodate high costs and tight living spaces in exchange for social and cultural benefits to urban living. However, municipal cuts to essential services such as police, transit, sanitation, and parks, along with limited cultural opportunities owing to social distancing have now skewed that trade-off. Both workers with the flexibility to move and those who lost jobs during the pandemic may be prompted to relocate, a particularly acute problem in markets like New York and San Francisco. Governor Cuomo’s office projects that New York City and other local governments will face $13.5 billion in shortfalls over the next two years, while San Francisco faced a historic $1.5 billion deficit over that span that has already forced an increase in business taxes to help address the issue. Even if budget issues are addressed with higher taxes, such steps could erode the tax base in years to come if workers and businesses leave to avoid this growing burden, especially if remote work makes such moves more practical.
While robust data on COVID-related migration is not yet available, an analysis of USPS Change of Address requests by MyMove showed that requests from February through July 2020 were up 4% from the same period a year ago. Though the requests for temporary moves (those intended for less than six months) were up significantly more at 27% compared to 2% for permanent, these moves will still have short term effects, and could become permanent as the pandemic drags on. Many of the cities that lost the most movers in 2020 already saw the most movers leave in 2019, but many of these still saw a staggering acceleration.
EXHIBIT 14: CITIES THAT GAINED AND LOST THE MOST MOVERS FROM FEBRUARY THROUGH JULY 2020
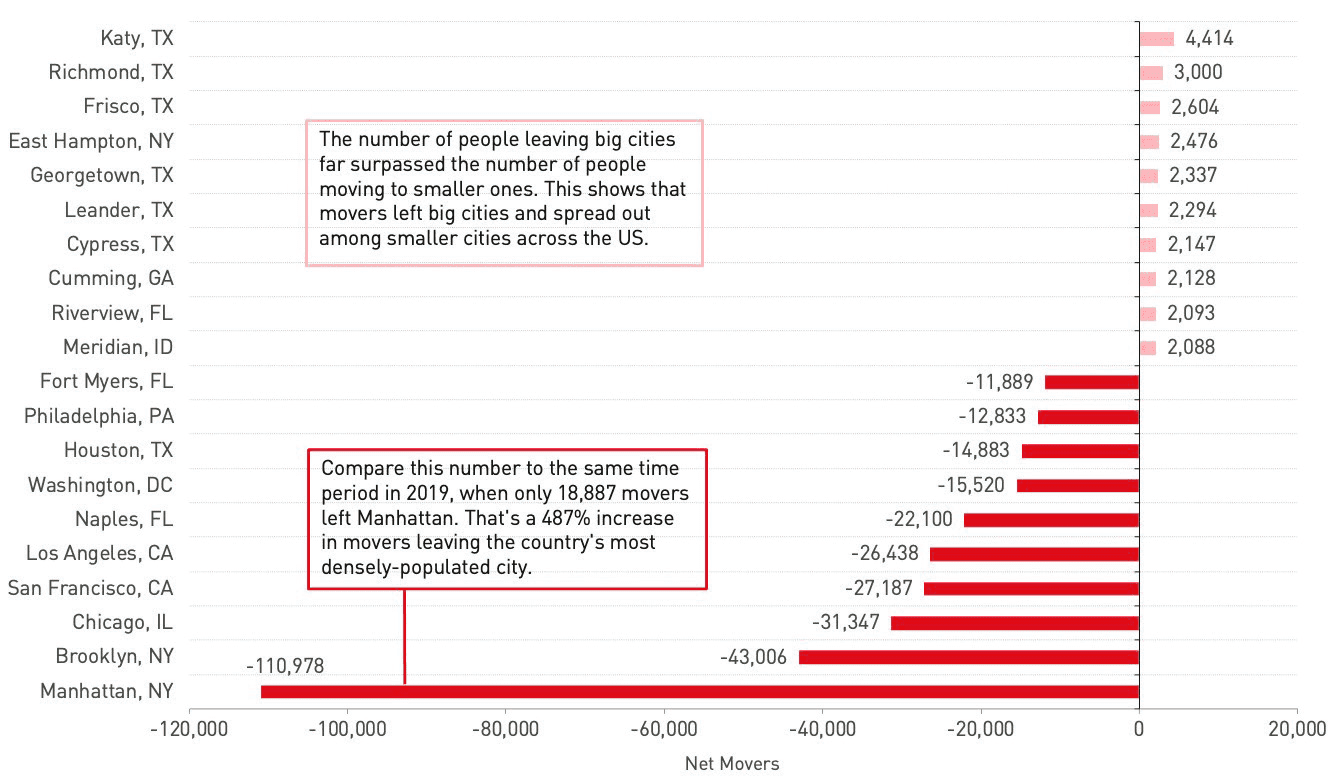
Manhattan led the nation with more than 110,000 lost movers in 2020, compared to less than 19,000 in 2019, while San Francisco saw nearly triple the amount of movers leave in 2020 compared to 2019. Chicago and DC were also notable with roughly double the number of lost movers in 2020. Unsurprisingly, some of the largest mover gains were seen in less urban areas. Six of the top ten cities were in Texas, which features lower costs of living, lower taxes, and more space, while East Hampton, NY made the list as well, a beneficiary of the exodus from New York City.
The movement of workers in the aftermath of COVID-19 could have a sizeable impact on state and local fiscal budgets. States facing the most severe structural fiscal imbalances could be forced to address them by hiking taxes, reducing spending on services, or some combination of both.
History has demonstrated that both individuals and businesses respond to a range of issues in making their location decisions. State and local tax burdens, as well as the scope and quality of government services are important influences in these decisions. The COVID-19 outbreak could both enable and accelerate the relocation of workers and businesses, as the pandemic will further burden state and local budgets, particularly those that already have high taxes, making households and businesses even more acutely aware of the tax burdens they are subjected. The impact of ensuing fiscal and regulatory policies may be a substantial factor in future regional growth patterns and, therefore, commercial and residential real estate trends.
DOWNLOAD A PDF OF THIS ARTICLE
—
ABOUT THE AUTHORS
Russell Appel is Founding Principal at the Praedium Group, a real estate investor focusing on middle-income rental housing in suburban growth markets throughout the United States. Peter Muoio, Ph.D. is a Senior Director and Head of SitusAMC’s Insights division. Cory Loviglio serves as Vice President within the division. SitusAMC is a leading provider of innovative technologies and expert-led services for the real estate finance industry.
—
NOTES
1. “How does the deduction for state and local taxes work?” Tax Policy Center, May 2020, taxpolicycenter.org/briefing-book/how-does-deduction-state-and-localtaxes-work
2. Russell Appel, Peter Muoio, and Cory Loviglio. “State Fiscal Pressures and CRE.” Spring 2018, praediumgroup.com/wp-content/uploads/2019/09/PREA_Quarterly_Summer_2019_Feature_Fiscal_Pressures-002.pdf
3 Hickman, Adam and Lydia Saad. “Reviewing Remote Work in the U.S. Under COVID-19.” Gallup, May 25 2020, news.gallup.com/poll/311375/reviewingremote-work-covid.aspx