

Traditional North American office underwriting implicitly assumes greater tenant independence in lease renewal decisions than exists in practice. This article explains why renewal decisions are actually correlated, and bounds the plausible magnitude of the effect, illustrates how it changes the shape of downside risk, and proposes three simple metrics that better communicate downside risk to investment committees.
What is the likelihood of actually achieving the underwritten cash flow in an Argus model? Consider an office acquisition in North America.
The seller’s material will commonly contain an Argus-created cash flow model with all the existing leases modeled. It is deterministic on the renewal probability but silent on the question of interdependence among tenants’ renewal decisions and silent on any probability around that mean. We know that tenants are not 100% correlated in renewal decisions; you may be able to renew one tenant but not another in a similar period. But intuition and experience also tell us that tenants are not 100% independent—factors affecting one tenant’s desire to renew their lease in place are similar to those the next tenant will face. Clearly, if you have a single-tenant building, you have no diversification. But what if you have fifteen tenants? How much diversification do you have then?
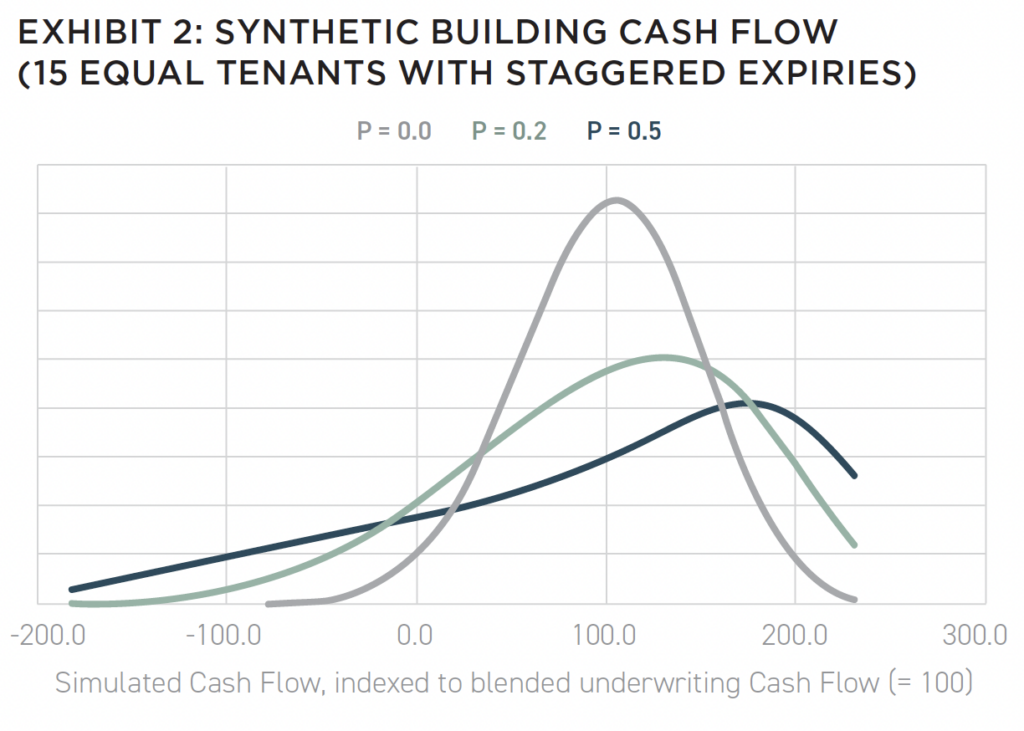
I posit that tenants’ renewal decisions do not occur independently, and are correlated to each other, creating longer and fatter tails that skew on the downside than an assumption of independence would suggest.
DOES IT MATTER?
Yes, absolutely, and especially for office leasing, since the capital costs are so high, as detailed later in this article.
It matters for three key reasons:
- depending on asset details, the possibility that the asset requires an equity contribution or has negative cash flow in any one year will increase;
- the probability of breaching a debt service coverage ratio (DSCR) threshold can change materially, while the severity of downside outcomes can increase as the distribution around the mean cash flow becomes longer, fatter, and more left-skewed; and
- the amount of actual diversification achieved in a multi-tenant building decreases dramatically.
The mean NOI and cash flow after leasing capital costs that is output by the Argus run is not wrong—or at least it might not be wrong—but it is silent on any probability around the mean. An analyst can easily adjust assumptions to modify the model, including renewal probability and leasing costs at the end of the lease, to create a mean-weighted cash flow for each period.
Most use a 75–80% renewal probability, depending on the market, with adjustments per tenant if there is specific intelligence that suggests otherwise. The Argus cash flow does not typically run simulations, although it can, to model a probability distribution that would show the likelihood of achieving that cash flow. This is the industry standard. Most equity investors do not run supplementary simulations to evaluate probabilities, although many will run a “worst case” and a “best case” in addition to the baseline.
The “worst case” stress test is useful to determine if you can survive it, but without a probability attached to it, it is easy to dismiss. The better approach would be to determine the downside scenario that has a 20% probability of occurring, for example. What is the one-in-five-year worst case? The assessment of how likely a “worst case” may be is not commonly projected.
If an analyst ever did run a simulation, the simplified assumption would be that leases are not correlated at all: rho = 0. This delivers an output that has artificially thin tails and downside probabilities are underrepresented. The “worst case” would appear less likely or, if we define “worst case” as a one in twenty event, the “worst case” is artificially closer to the mean. It’s not only that downside returns may be worse; the frequency and severity of DSCR shortfalls can also be misrepresented.
HOW MANY TENANTS ARE THERE REALLY?
Remaining silent on correlation also invites the assumption that a building with more tenants is more diversified. A building with fifteen tenants appears very diversified. If rho = 0, this holds and the owner reaps the diversification benefit of many tenants making independent renewal decisions. Once you introduce even a small correlation in lease renewals, that diversification effect starts to diminish quickly. From portfolio theory, the net effective number of tenants, without weighting for size, is:
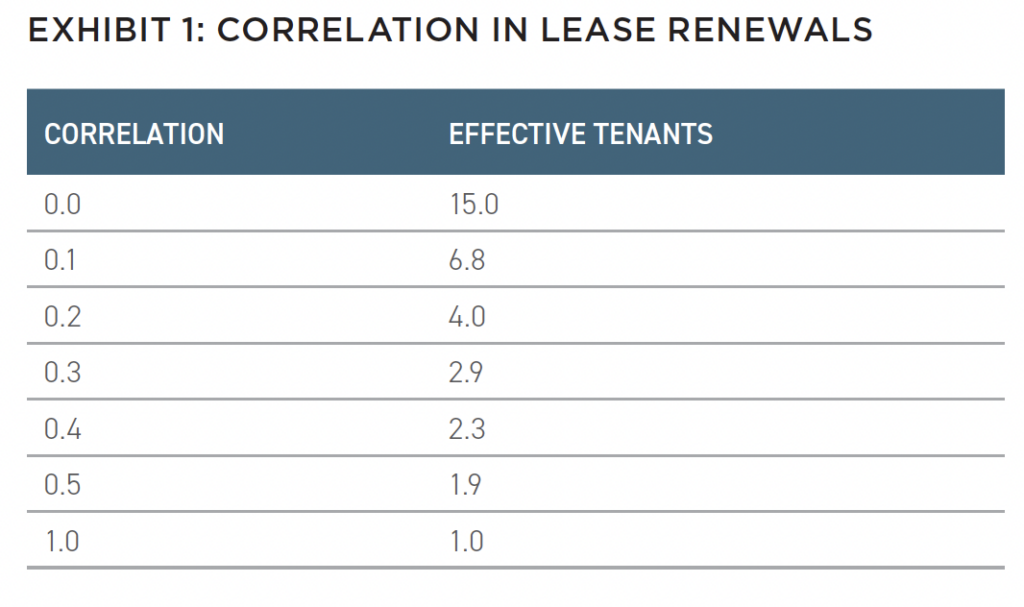
And you get what we see in Exhibit 1.
At the lower end of correlation, the effect is most dramatic. Even at a modest correlation of rho = 0.3, the effective number of tenants has dropped from 15 to only 2.9.
Alternatively, the probability of the doomsday scenario of having a completely vacant building in a hypothetical simulation is one in a billion when tenants act completely independently. As an illustrative stress outside my central calibration range, increasing the correlation to rho = 0.4 raises that probability to roughly one in three hundred.
WHY WOULD TENANT RENEWAL DECISIONS BE CORRELATED?
First (and this one you can see in the rent roll) tenant renewals may be lumped together in a shorter period. Real estate cycles vary in length but tend to be several years long. Tenants renewing even a few years apart may be faced with very similar market conditions. In the eight years she studied, Asser found that the renewal probability varied by year from a low of 52.7% in 2001 to a high three years later of 87.4%.[i]
Second, tenants looking to renew or vacate are often faced with the exact same submarket alternatives. If the market is soft, they have the same discussions with competing landlords trying to lure them away from the building. Tenant inducements to relocate, including free rent and buildout costs, will be similar. In a tight market, they will have fewer attractive options unless they move out of the submarket.
New speculative supply in the market will create attractive alternatives for tenants simultaneously. It’s not just a downturn phenomenon; renewal decisions will be faced with similar alternatives in any market conditions. Although her study is dated, Asser demonstrated that renewal probability varied dramatically across the country depending on MSA, from a high in Charlotte at 97% to a low in San Jose of only 40%.[ii]
Lastly, buildings tend to attract tenants from similar industries. Finance companies cluster. Law firms cluster. Government clusters. Medical and biotech cluster.[iii]They are faced with similar industry-wide cycles and will tend to all be on the upswing or in a challenging environment at the same time.
RENEWAL IS NOT A BINARY OUTCOME
Not all renewals are desirable. The question is not only whether the tenant will renew. If you keep a tenant with lower rent, and high tenant improvement (TI) costs, and possibly reduced square footage, it’s better than vacant space, but it’s not a home run.
The “real” world is more correlated. The Argus-generated mean cash flow does not change; the tails are fatter and they skew left. Tails fatten because the probabilities increase at the extremes. It skews left because the upside is bounded by 100% occupancy, and leasing capital and downtime don’t have an upside mirror.
WHAT IS THE MAGNITUDE?
Real estate-specific data to pin down rho with real statistical confidence is not available in the industry literature, so instead I borrow a plausibility range from bank capital regulation. Basel II’s IRB framework—the rules banks use to calculate how much capital to hold against loan losses—assumes that a borrower’s risk of default depends partly on a shared, economy-wide factor and partly on that borrower’s own situation. This is the same basic structure for tenant renewals, with the clear acknowledgement that defaulting on a loan and choosing not to renew a lease are different things. But each tenant’s decision to renew or leave depends partly on a common market factor and partly on tenant-specific reasons.
Under Basel’s rules, the shared-factor correlation for corporate borrowers generally falls between 12% and 24%, depending on borrower risk and size. I use Basel only to show that correlation in this rough range is plausible and well-precedented in a comparable modeling framework. On that basis, I bound my central analysis at rho between 0 and 0.30. I treat rho = 0 as implausibly restrictive given the common market, timing, and industry drivers described above. Values materially above 0.30 are shown only as illustrative sensitivity or stress cases outside the proposed calibration range. Having a usable range is sufficient to demonstrate the effect and identify asset-specific risks.[iv]
The real estate literature is not entirely silent on simulating lease renewal risk. The closest antecedent is Amédée-Manesme et al., who combine Monte Carlo simulation with options theory to price the break options embedded in Continental European leases.[v] Their tenant carries no renewal probability at all. Instead, a tenant leaves whenever the current rent exceeds the simulated market rent by some threshold—a deterministic, rational-agent rule. Correlation enters only indirectly, through a shared, correlated market-rent process across submarkets, rather than through any parameter on the renewal decision itself. That is a sound solution to a different problem.
Continental European leases carry contractual break options tied to market rent; North American office leases do not, and the renew-or-vacate-at-expiry decision, governed by the renewal probability every Argus model uses, is a different decision to model.
Using a Gaussian copula, simulations on a synthetic office building of 15 equal-sized tenants clearly illustrate the increasing leftward skew as correlation (rho) rises. The mean cash flow for the sample year does not change—the deterministic mean value from an Argus is 100 in all three scenarios. Exhibit 2 includes rho = 0.5 as an illustrative stress case outside the central calibration range.
WHAT TO PRESENT TO THE INVESTMENT COMMITTEE
The solution is not to overwhelm the investment committee with reams of statistics. It can be simple and still contribute significant information. The blended cash flow, which is the standard output of Argus, is still important and should remain the focus of the analysis and decision making. Along with it, I propose three additional metrics.
First, the probability that the property will need a cash infusion in any one year. Second, the probability of breaching the DSCR assuming the buyer is using leverage. Or, if no debt is used, the probability that the cash flow falls below a chosen threshold percentage below the mean. And third, the effective number of tenants. If a property with fifteen tenants is effectively a property with 2 or 3 tenants because they act in tandem, that lack of diversification or additional risk should be taken consciously and modeled appropriately.
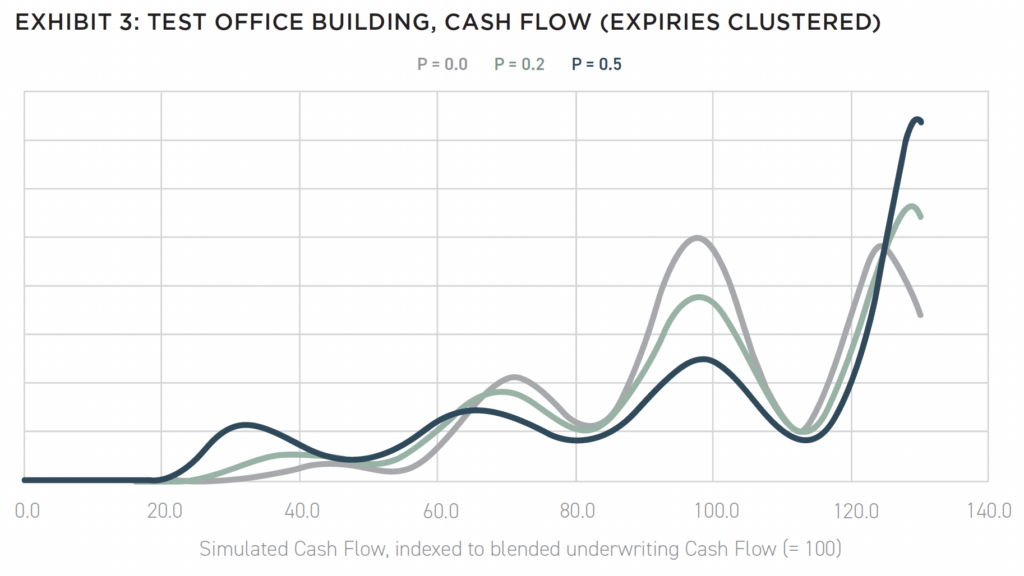
To illustrate this, let’s take a real building (anonymized to protect confidentiality) and run several Monte Carlo simulations (200,000 trials each) with varying correlation between tenant renewal decisions, as shown in Exhibit 3.
This actual rent roll is more lumpy than the synthetic example above, with an expiry cluster in years 2–3. Again, the mean cash flow does not change in any of these scenarios. Interestingly, in this real-life example, the cash-flow distribution becomes increasingly polarized—more like a single-tenant building—as rho increases. The likelihood of very good or very bad outcomes increases, while the probability of a middle-of-the-road result declines. In the anonymized real building, this is apparent in Monte Carlo simulations using the same Gaussian-copula structure, market assumptions on debt, and an assumed 1.2x DSCR test.
The Argus ten-year model shows no year with a mean negative cash flow, but there is significant roll in year two which, even with independent leasing decisions (rho = 0), has a 22% probability that cash flow will be negative. Increasing rho to 0.3 increases the probability to 25%. More significantly, in the cumulative ten-year cash flow, with rho = 0.3, the fifth percentile is 27% below the mean, while even the standard model is 15% under the mean. The risk is completely invisible when looking only at the mean, which does not change in any of these scenarios.
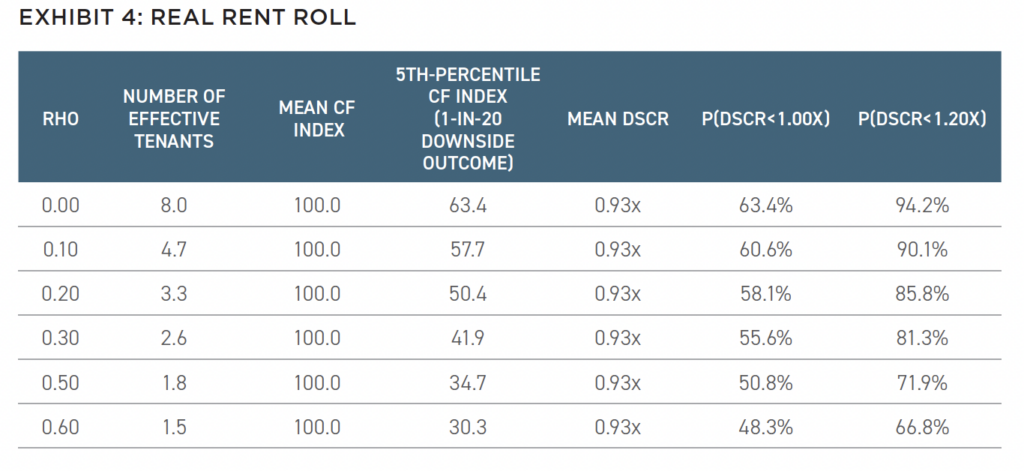
This real rent roll concentrates most of the leasing risk in one year, so in analyzing the risk of failing the DSCR, it comes down to that year; the other years do not risk a DSCR breach without tenant default or unless the landlord is unable to backfill vacancies.
If we focus on just that one year, as shown in Exhibit 4, the result is counterintuitive but instructive. As rho rises from 0 to 0.30, the probability of breaching the 1.20x threshold falls from 94.2% to 81.3%, even as the fifth-percentile cash-flow index deteriorates from 63.4 to 41.9. Because the mean DSCR is already below the threshold, greater correlation pushes more probability toward extreme outcomes on both sides; breach frequency falls, but downside severity worsens.
HAVE YOU SEEN THIS SOMEWHERE BEFORE?
A familiar cautionary parallel comes from structured mortgage credit before the GFC, where modeled risk was highly sensitive to assumptions about default correlation.[vi] When housing prices slumped across the country simultaneously, a cascade of events triggered the crisis. The difference between the CDO pricing approach and what I am proposing is that, in that case, correlation was minimized, resulting in lower perceived risk. The approach nevertheless shares an important limitation with those models: a Gaussian copula imposes limited tail dependence and may therefore understate joint downside scenarios.
HCORRELATION IS THE MISSING ASSUMPTION
I have shown why treating tenant renewal decisions as independent is unlikely to be realistic and that even modest, assumed correlation can materially change the distribution of cash flow, particularly in the downside tail. Office leasing is capital intensive, so the skew is more on the downside.
I have deliberately modeled only one factor that impacts the success of a real estate investment. Presumably, some of the same factors that affect tenants’ renewal behavior also impact market rents or the ability of one particular landlord to push rents up. Interest rates and cap rates, which have an outsized impact on value, may similarly be moving in the wrong direction when tenants are not renewing, further compounding the challenge. I have shown that the correlation assumption matters and suggested three simple additions to the deterministic mean cash flow.
Hopefully you will consider some of the suggested improvements to a standard Argus run in your next investment committee memo.
+ ISSUE 22

NOTE FROM THE EDITOR: ISSUE #22
AFIRE 2026 Mid-Year Pulse Survey Report (P. 6)
Market Mitigation: American Economic Power Translates into CRE Opportunity (P. 18)
Real Estate in the Next Cycle: A New Generation of Investment Ideas for the Built Environment (P. 26)
The Narrow Gate: Who Actually Raises Foreign Capital for US Real Estate (P. 36)
Middle East Institutional Capital and US Real Estate: Are They Still Friends?(P. 42)
Arbitrage in Plain Sight: How “Bucketized” Capital and Lost Skills Leave Billions on the Table (P. 52)
Real Estate Credit Reimagined: Private Credit and Debt Capital Markets (P. 60)
(Re-)Industrial Demand Drivers: From Efficiency to Resiliency (P. 66)
Zombie Funds or Patient Capital: Age Alone Cannot Distinguish a Stagnant Fund from a Disciplined Vehicle (P. 72)
Upending Underwriting: Fat Tail Risks in North American Office Investments (P. 76)
The Economics of Place: Quantifying the Mixed-Use Premium (P. 82)
The Overlooked Gateway: Opportunity Zones and Cross-Border Capital (P. 88)
Opportunities in Pro-Housing Policy Shifts: Investing in Markets with Public Policy Support (P. 94)
Rethinking Luxury Hospitality: Transforming Complexity into Long-Term Value (P. 100)
Before the Next Decision: Field Work to Organizational Capability (P. 108)
The Maturity Wall Is Already Here: Why the Headline CMBS Delinquency Rate Understat
+ ALL ARTICLES
+ ARCHIVE
+ LEADERSHIP
+ POLICIES
+ GUIDELINES
+ CONTACT
+ MEDIA KIT (PDF)
DISCLAIMER
The publisher of Summit is not engaged in providing tax, accounting, or legal advice through this publication. No content published in Summit is to be construed as a recommendation to buy or sell any asset. Some information included in Summit has been obtained from third-party sources considered to be reliable, though the publisher is not responsible for guaranteeing the accuracy of third-party information. The opinions expressed in Summit are those of its respective contributors and sources and do not necessarily reflect those of the publisher.
NOTES
[i] Asser, Rebecca. 2004. The Determinants of Office Tenant Renewal. Master Thesis, Boston: Massachusetts Institute of Technology.
[ii] Asser, 2004
[iii] Liu, Crocker H., Stuart S. Rosenthal, and William C. Strange. 2024. “Agglomeration Economies and the Built Environment: Evidence from Specialized Buildings and Anchor Tenants.” Journal of Urban Economics.
[iv] Bank for International Settlements. 2005. “An Explanatory Note on the Basel II IRB Risk Weight Functions.” Publications. July. Accessed August 2026. https://www.bis.org/bcbs/irbriskweight.htm.
[v] Amedee-Manesme, Charles-Olivier, Fabrice Barthe´le´my, Michel Baroni, and Etienne Dupuy. 2013. “Combining Monte Carlo simu
[vi] Salmon, Felix. 2009. “Recipe for Disaster: The Formula That Killed Wall Street.” Wired, 02 23.
ABOUT THE AUTHOR
Peter Grey-Wolf is President of the Canadian subsidiary of UniCredit Invest Alternatives, with more than twenty years of experience bridging German institutional capital and North American commercial real estate markets. He has served on AFIRE’s Executive Committee and on the Summit Journal’s Editorial Board.
The views expressed in this article are those of the author and do not necessarily reflect the views of UniCredit Invest Alternatives.