
WILL REAL ESTATE PORTFOLIO DIVERSIFICATION PROTECT YOU IN THE NEXT DOWNTURN?
Investors in property commonly cite portfolio diversification as a main attraction.1 With the US macro economy and commercial real estate cycles generally viewed as nearing a down cycle, the need to tap diversification benefits from real estate may soon be at hand. Should you worry?
Let’s look at history.
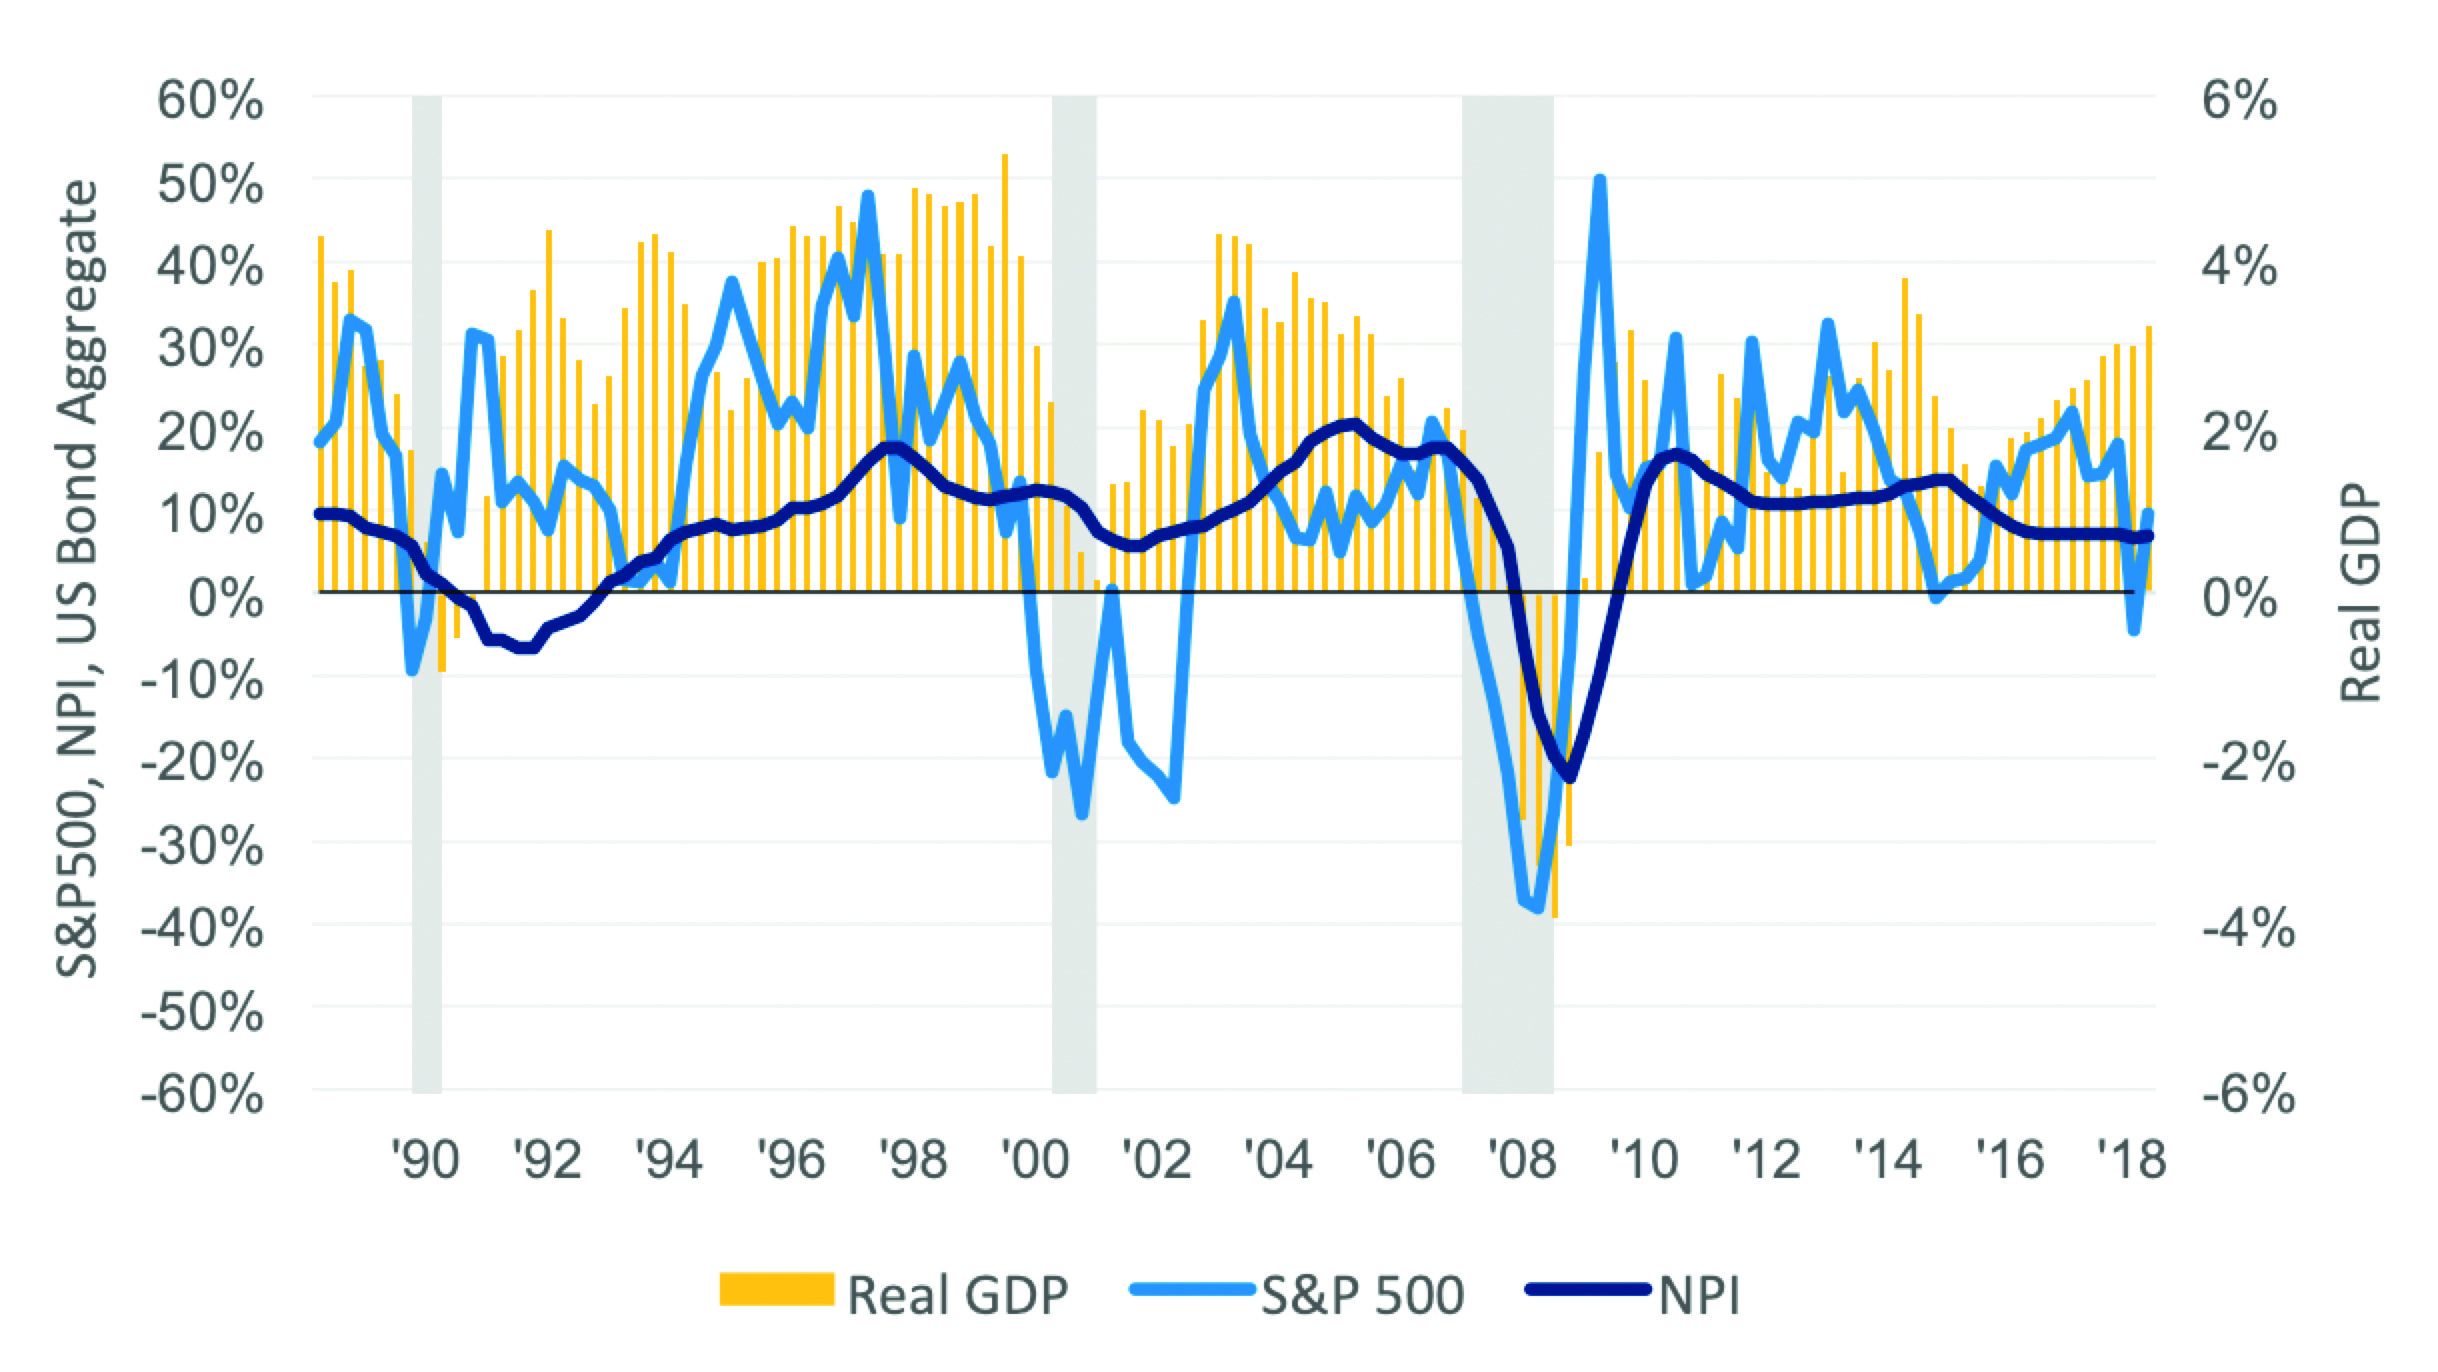
Real estate was a powerful diversifier in the 2001 recession (Exhibits 1 and 2). Throughout 2001, the NCREIF Property Index (NPI) total return produced positive results as net operating income cushioned the minor 1.1% decline in property values.2 In contrast, the S&P 500 total return declined 21.7% over that period while GDP growth slipped into negative territory in both the first and third quarters of 2001.3 During the most recent recession, real estate’s diversifying power was not as great. During 2008 and 2009, the NPI total return dropped 24.1% over seven quarters while the S&P 500 dropped 45.8% from peak to trough, and GDP shrunk repeatedly over five quarters.2,3,4
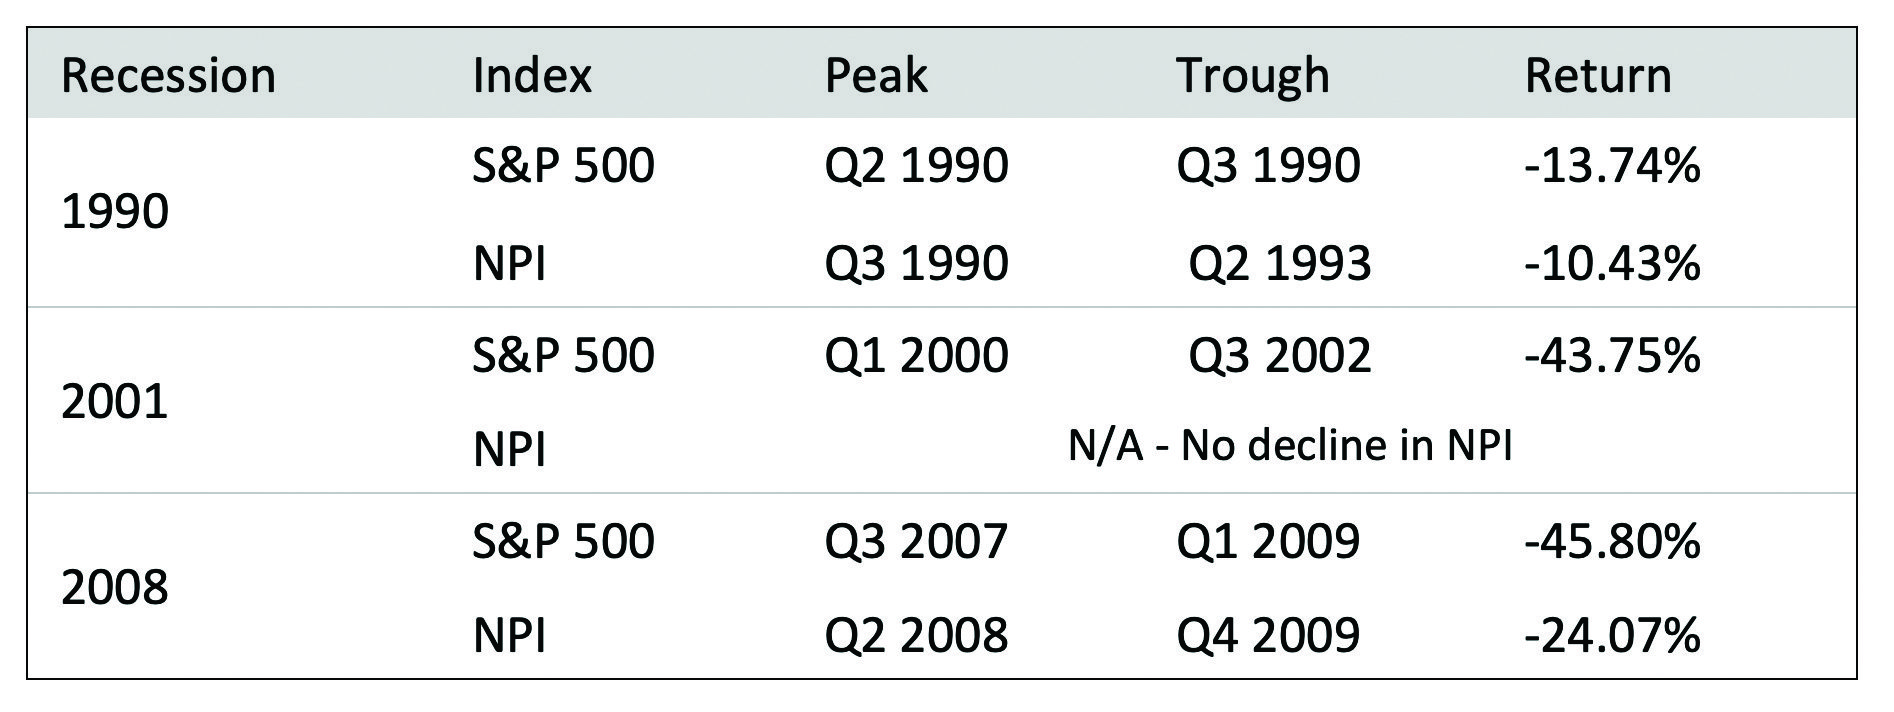
(Source: Bureau of Economic Analysis, as of April 29, 2019; S&P Dow Jones Indices, Moody’s Analytics, as of March 31, 2019; and NCREIF, as of March 31, 2019.)
The differing impact of the two recessions on real estate investments cannot be traced to imbalances in US property markets. Prior to both recessions, vacancy rates were below their long-term averages across the four main property sectors and new construction pipelines were modest.5 Rather, the differences can be traced to the varying degrees of deterioration in investor risk appetites and in the employment situation. Investor risk appetite affects the pricing of investment assets; for real estate, it can be shown in capitalization rate spreads over Treasury yields. Exhibit 3 shows the modest widening in cap rate spreads in 2001 versus their blow-up in 2008.
Similarly, the US economy shed 2.5 million jobs during the 2001 recession and its aftermath, versus a loss of 8.6 million resulting from the 2008 recession (Exhibit 4).6 Nonagricultural employment peaked in February 2001 at 132.8 million and troughed in August 2003 at 130.2 million; it peaked next in January 2008 at 138.4 million and troughed in February 2010 to 129.7 million.7
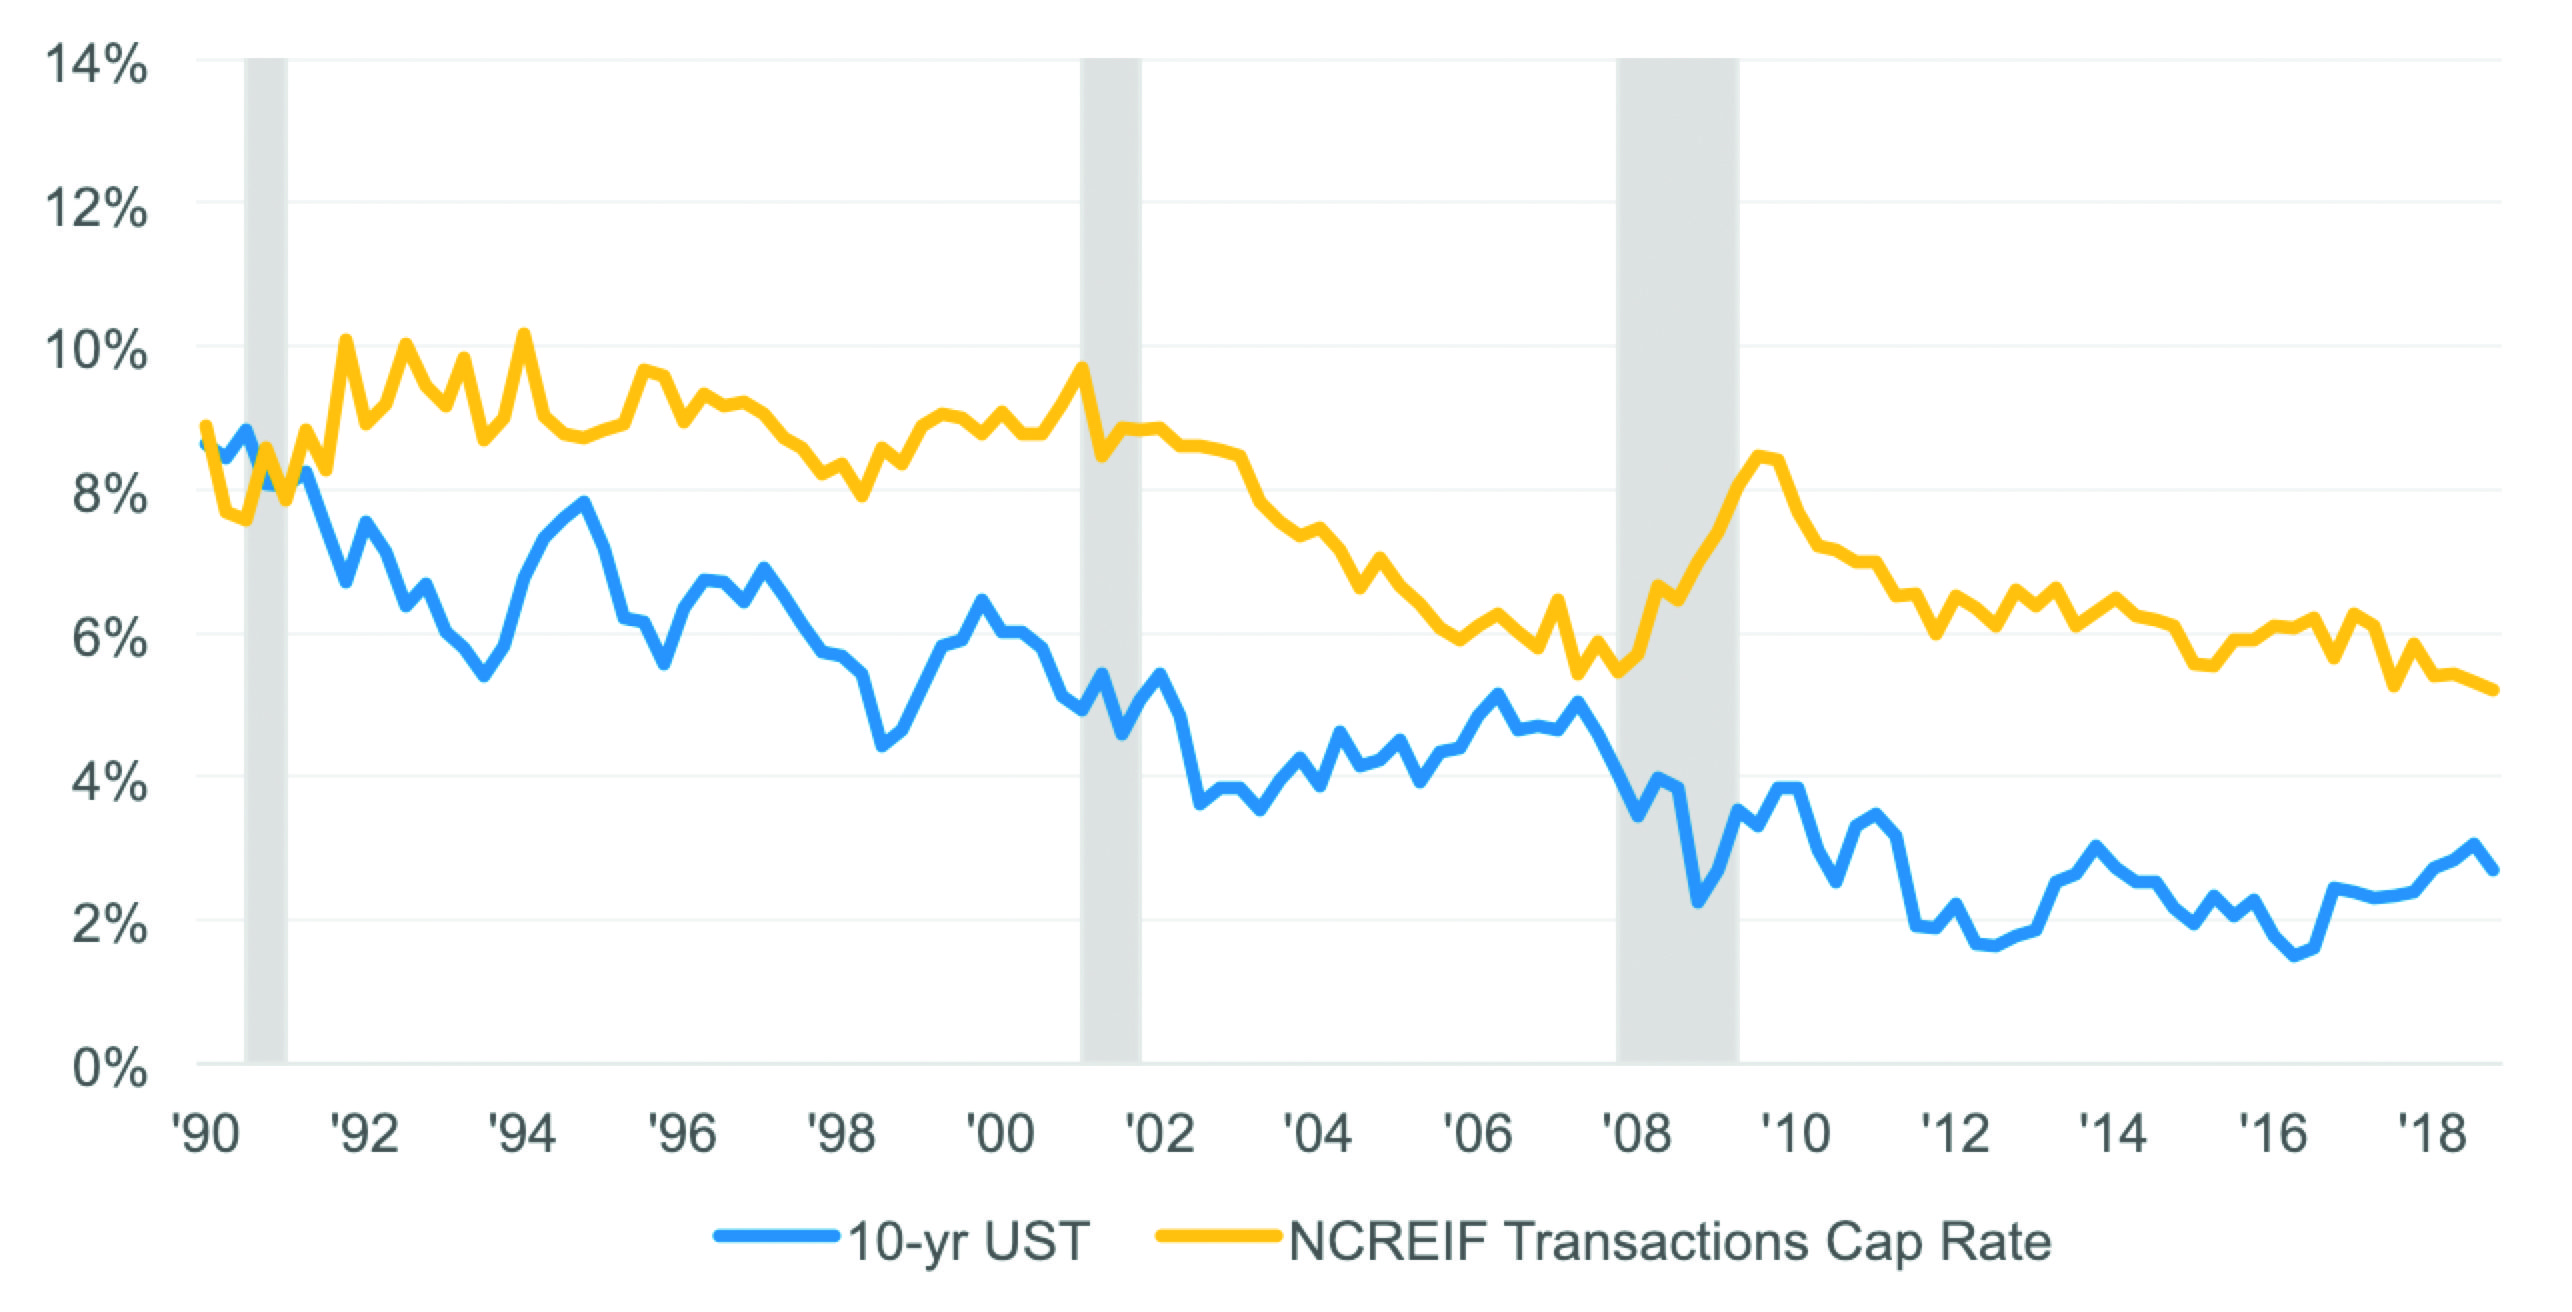
(Source: Federal Reserve and NCREIF, as of March 31, 2019.)
In 2019, the four major property sectors – apartments, industrial, office, and retail – are similarly in balance with a few instances of exuberant apartment construction in a handful of metro areas. Investor risk appetite is holding up well, with cap rate spreads slightly below their long-term average and property transactions continuing apace. However, GDP growth is slowing, employers are increasingly citing labor shortages, and the Treasury yield curve is flirting with inversion. Few economists ever forecast a recession but rather tinker with their estimates of the odds of recession. As of June 2019, the odds for a recession this year are 22.3% and 38.4% in 2020.8 If a downturn does occur, the next question to ask is, how severe will it be?
DIVERSIFICATION MAY PROTECT YOU
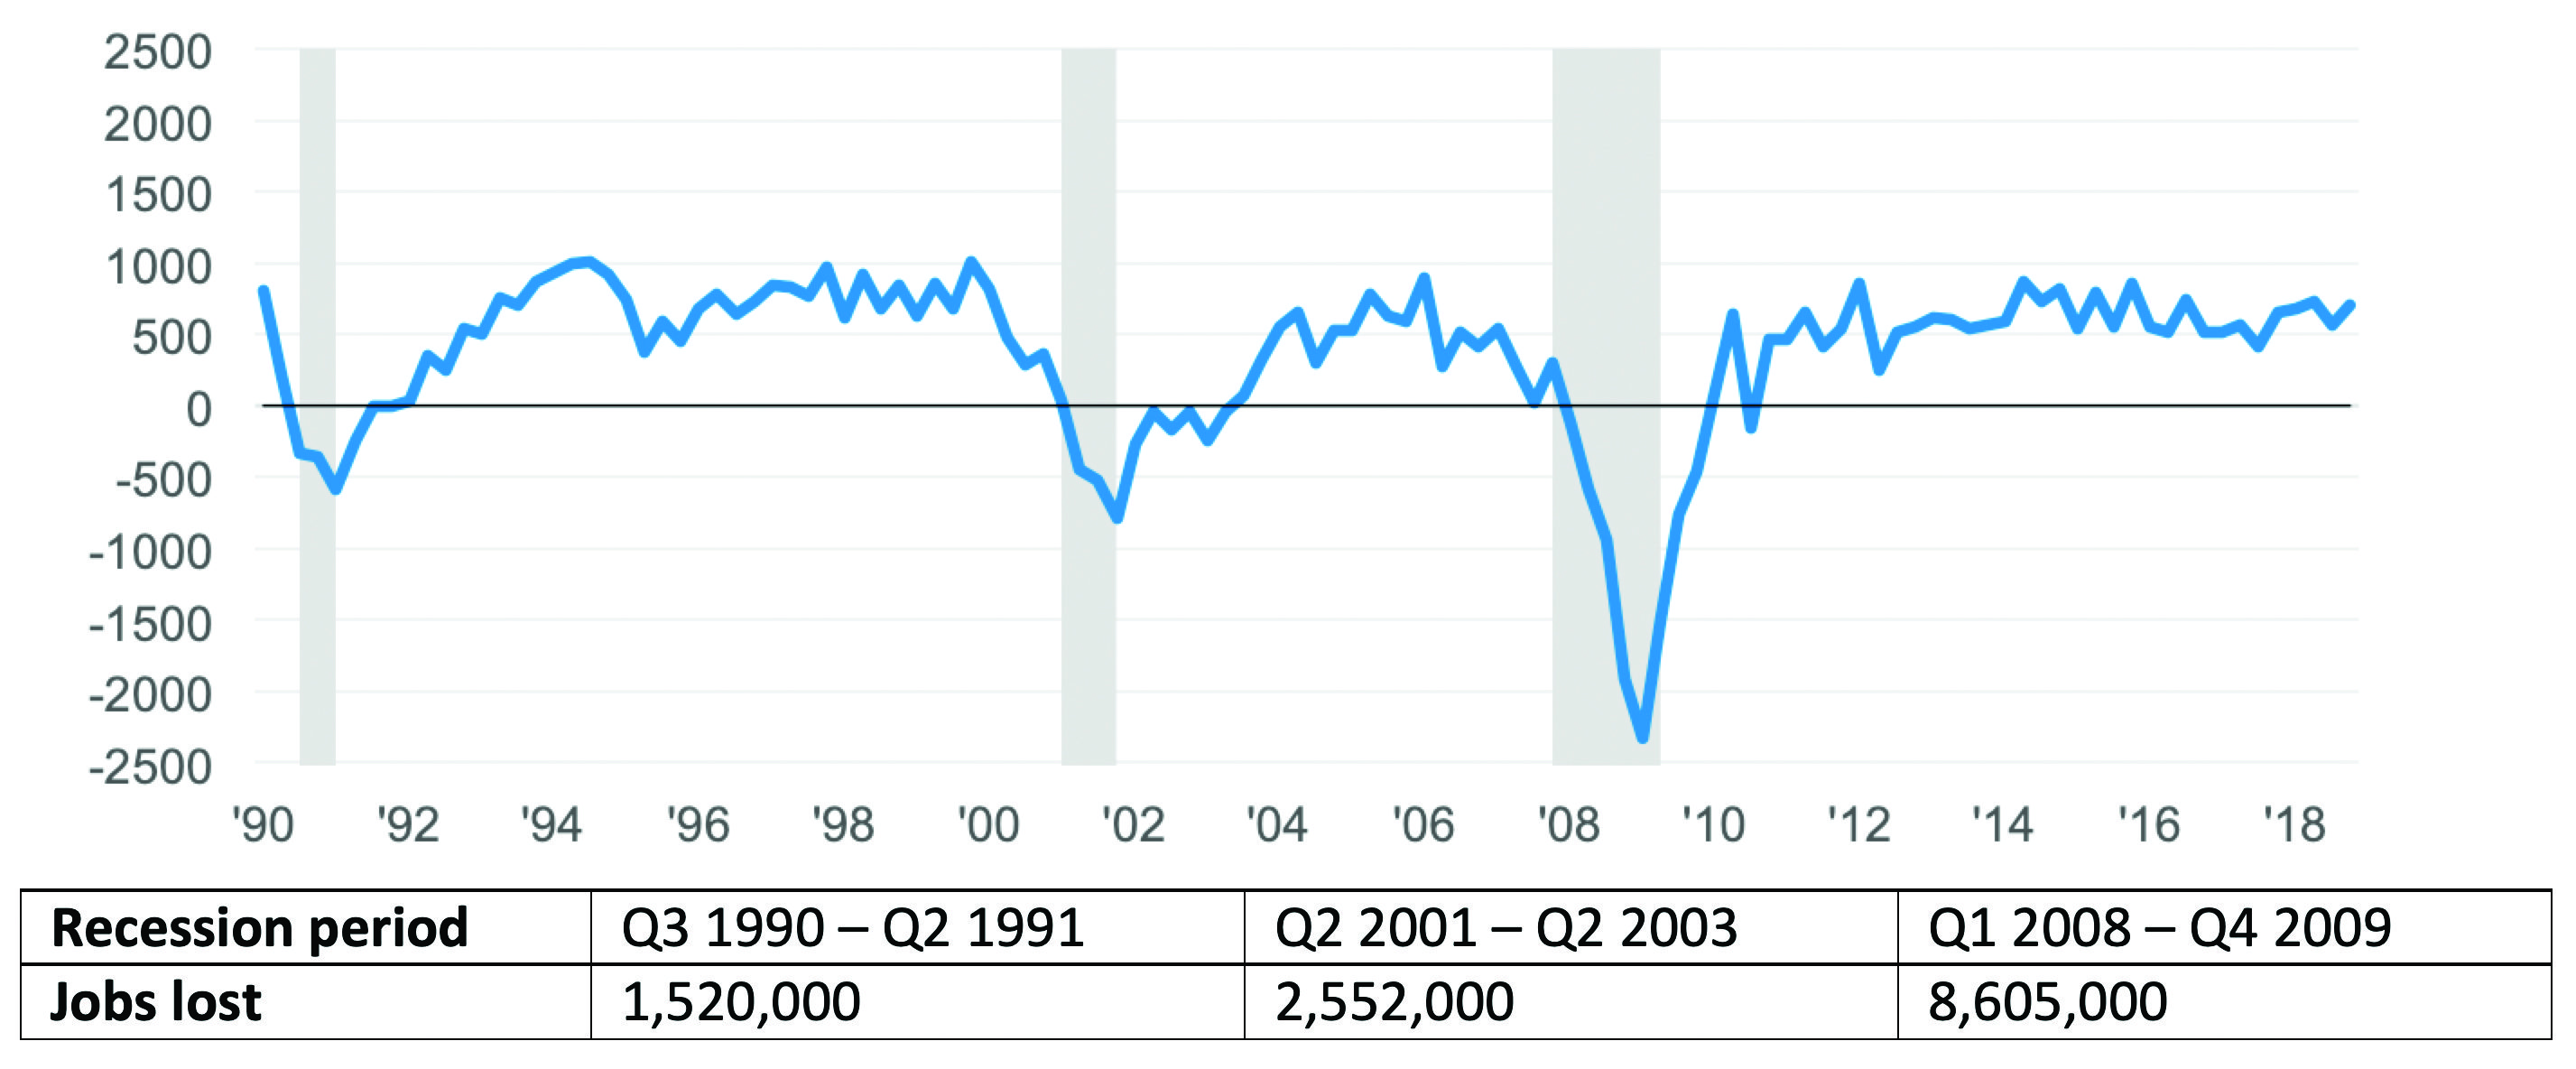
(Source: Bureau of Labor Statistics, as of April 29, 2019.)
If the next downturn is more similar to 2001 than to 2008, the NPI might avoid negative territory just as it did in 2001. But that doesn’t mean that all investors in US property will have similar success. In order to enjoy diversification benefits similar to the NPI benchmark, investors need to hold portfolios that mirror the benchmark’s performance, which requires portfolios diversified enough to squeeze out idiosyncratic risk. For example, during the worst four quarters of the last recession, the NPI total return was a negative 22%.2 However, the best quartile of properties delivered a negative 12% while the worst quartile reported a negative 28%.9
Research shows that it takes quite a large number of properties to squeeze out idiosyncratic risk and mirror the NPI – as many as 100.10 However, this estimate is based on choosing properties at random from the NPI database. Applying investment and portfolio management expertise can reduce the need for so many properties through careful property selection, buy-sell timing, property operational management, and portfolio risk control.
The challenges associated with squeezing out idiosyncratic risk are shown in the dispersion of investment performance among the properties in the NPI (Exhibit 5). In the year ending in December 2018, there were 6,897 properties in the NPI spread across apartment, industrial, office, and retail properties. The median total return was 8.56% with half of the properties producing stronger return and half producing weaker return. Exhibit 5 shows the dispersion of performance; it is pretty enormous. The top-performing quartile of properties had total returns of at least 13.9%, with the top 5% at least 25.6%. The bottom quartile had total return of less than 4.8%, with the bottom 5% less than -4.1%.2 The dispersion of performance varies over time – tightening in good times and widening in bad.
STRATEGIZING PORTFOLIO DIVERSIFICATION
Strategies for selecting properties with better return prospects vary across investors and real estate fund managers. Some strategies introduce risks not incorporated into the NPI with the hope of juicing return. These include using leverage (NPI return is unlevered) and/or selecting properties in “noncore” style categories; the NPI is composed largely of “core” properties which are within the four major property sectors, “stabilized” and producing rental income. Other styles are “value-add,” which involves major capital investment in improving properties, and “opportunistic,” which is new development. Both styles commonly involve significant leverage. Straying from the major property types into specialty properties such as self-storage, student housing, or nursing homes, can also enhance return but introduces risks not typically associated with core properties.
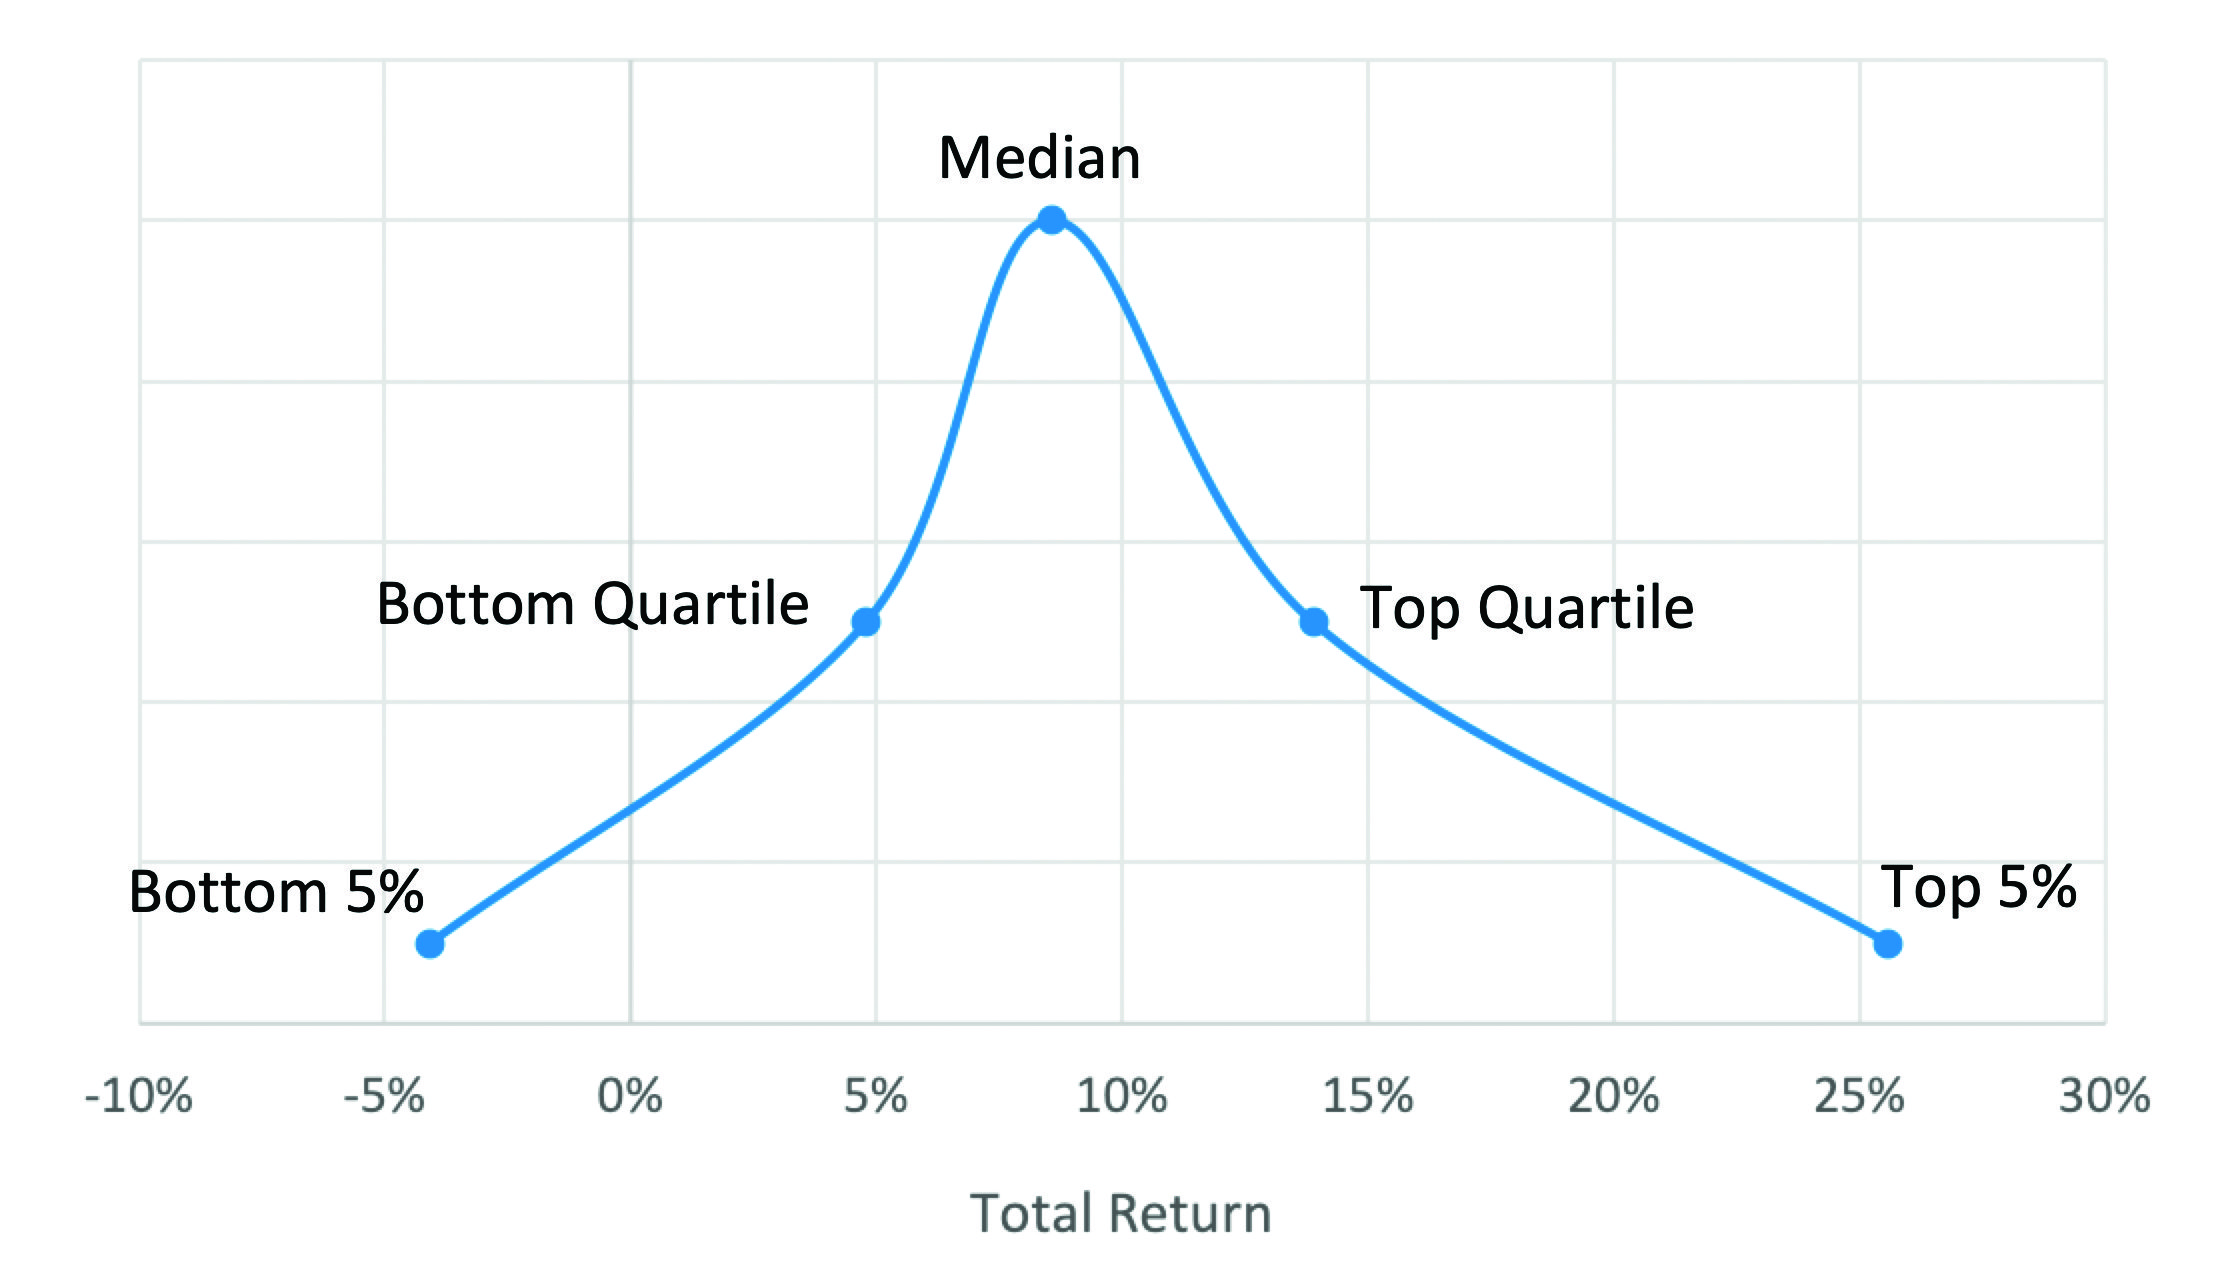
(Source: NCREIF, as of December 31, 2018)
More straightforward techniques for composing more promising portfolios involve assessing the potential for return associated with different geographies. Many investors target specific metro areas for investment and avoid others. Strong economic and demographic growth along with disciplined construction are often the drivers of market targeting. Over the last 20 years, the ten strongest-performing metros have produced an average of 10.2% total return per year while the weakest ten returned, on average, only 6.8% per year.2
While metro market location certainly matters, investors can sometimes overcome weak metro performance by selecting top performing properties. Expert investors will assess the competitiveness of properties in their neighborhoods and among peer properties. They will also pay special attention to portfolio construction and avoid concentrated lease maturities over the portfolio’s investment horizon and assess the lease structure of each property within their larger portfolios. Investment size is important as well; large bets on one property can compromise diversification.
Finally, expert investors will track both the macro-economic cycle and the real estate cycle. “Buying low and selling high” is the goal, but the uncertainty of cycle timing makes this difficult to accomplish. Rather than concentrated cycle-timing bets, investors may be better off spreading investments over the cycle and thereby take advantage of yet another source of diversification.
When talking about diversification, experts will often advise not to put all your eggs in one basket. It’s a catchy idiom, and easy to remember, but only a starting point for thinking about diversification.
—
ABOUT THE AUTHOR
Martha Peyton is Managing Director of Applied Research for Aegon Real Assets US. Aegon Real Assets US is an indirect wholly owned subsidiary of Aegon N.V.; is a US-based investment adviser registered with the Securities and Exchange Commission (SEC); and part of Aegon Asset Management, the global investment management brand of Aegon Group.
NOTES
1. Pension Real Estate Association, as of September 30, 2018
2. National Council of Real Estate Investment Fiduciaries, as of March 31, 2019
3. S&P 500 Dow Jones Indices, Moody’s Analytics, S&P 500 Quarterly Returns, March 31, 2019
4. Bureau of Economic Analysis, Gross Domestic Product First Quarter 2019, April 26, 2019
5. CoStar Realty Information Inc., as of March 31, 2019
6. Bureau of Labor Statistics, The Employment Situation, April 5, 2019
7. Bureau of Labor Statistics, The Employment Situation, May 16, 2019
8. Blue Chip Economic Indicators, as of June 10, 2019
9. National Council of Real Estate Investment Fiduciaries, Performance Report, as of December 31, 2018
10. Jeffrey D. Fisher and William N. Goetzmann, “Performance of Real Estate Portfolios,” The Journal of Portfolio Management, Special Real Estate Issue, 2005