
Both savvy investors and academic literature are acutely aware that many fundamental measures of the US real estate market vary widely depending on the metropolitan area examined
If I hadn’t already realized the impact of cross-border capital on the United States commercial real estate market, it did not take long once I began my studies at MIT’s Center for Real Estate. More precisely, my classmates and I received this lesson from the very first guest speaker who visited, in the very first week of our first semester: “I can’t find a deal in New York anymore,” Mr. CW1 lamented, “because the foreign money has driven prices to a level where I can’t possibly justify the return to my investors.” From there, the drumbeat only intensified. A fundamental shift had occurred, we were told; and investors, fund managers, and developers alike were all trying to make sense of just what this shift was actually doing to markets. In the case of some, such as Mr. CW, they had already decided what was happening – quite simply, growth in cross-border capital was causing growth in prices.
MR. CW AND THE MARKET(S?)
Intuitively Mr. CW’s opinion seems reasonable. Sound macroeconomic theory should normally dictate that, all else equal, increased demand will lead to higher prices. Moreover, the media have done an excellent job of publicizing stories of foreign purchasers paying lofty sums for prime real estate trophy properties in gateway markets like New York City.2 There is also data supporting this concept; Geltner and van de Minne found that between 2005 and 2015, over 60% of all cross-border purchases were for more than $8 million, with over 40% for more than $16 million.3 The logical implication of this evidence is that an increase in both the raw volume and concentration of cross-border capital is likewise causing an increase in prices in gateway markets, if not the United States real estate market as a whole.
But could it not just as easily be the other way around? That is, cross-border investors – possessing attributes and priorities distinct from their American competitors – are merely followers of price, displaying the characteristics of classic herd behavior in response to market fluctuations. Or, perhaps, the reality is more nuanced than that; after all, while it’s easy to talk of “the market” as a single geographic entity, both savvy investors and academic literature are acutely aware that many fundamental measures of the U.S. real estate market vary widely depending on the metropolitan area examined.4
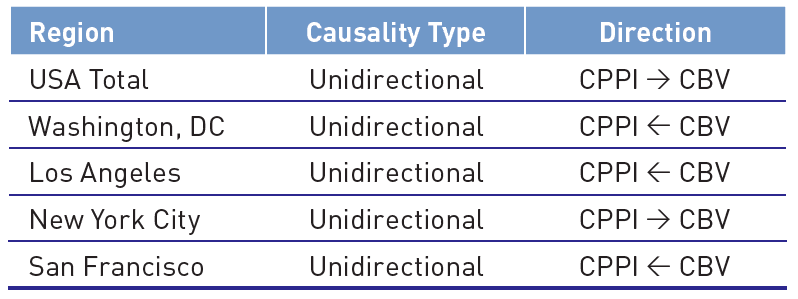
And in fact, a rigorous quantitative analysis revealed that is precisely what is going on when we look for causation between cross-border investment and commercial real estate prices.5 Mr. CW was right! Well, he was half-right. Increased cross-border capital is unquestionably driving up prices, but not in New York City. If we give Mr. CW the benefit of the doubt and suppose that his tales of misery were instead drawn from his experiences in the next three largest US real estate markets – Los Angeles, San Francisco, and Washington, DC – then we can give him full credit for his insights. This same quantitative analysis found that in each of those three metros, changes in cross-border capital are unquestionably causing changes in price. However, in New York City, the causality is equally strong but in the opposite direction; price changes are causing corresponding changes in the flow of cross-border capital. In the most gateway of gateway markets, despite a great deal of anecdotal evidence to the contrary, the data simply does not support a finding that the rise in “foreign money” is causing prices to increase in a statistically meaningful way. Moreover, what’s true there is precisely the converse! Interestingly, this same effect was observed on a macro level when looking at the total US real estate market.
THE DATA AND ANALYSIS
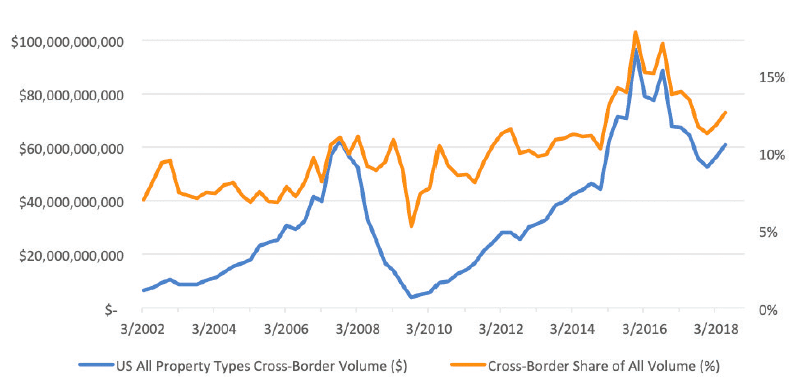
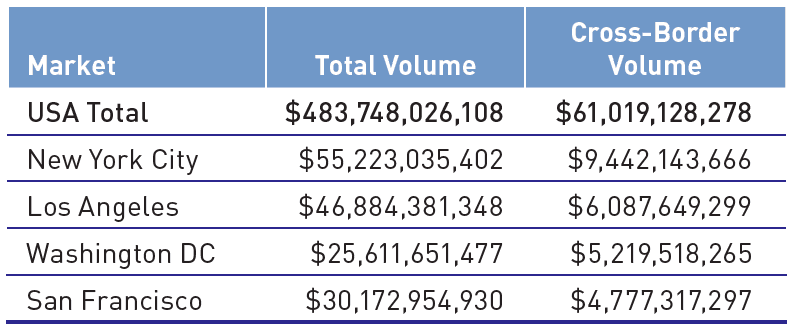
Since the turn of the 21st century, cross-border transaction volume in the United States commercial real estate market has rocketed upwards. As recently as 2002, cross-border volume in American commercial real estate accounted for just $6.5 billion in annual transactional activity, or approximately 7% of all United States volume. By the end of 2015, those figures had exploded to more than $96 billion annually and nearly 18%. While cross-border volume has leveled off slightly from its 2015 peak, this now highly significant source of capital still accounts for $61 billion annually (a nearly tenfold increase in less than two decades) and 12.6% of all volume (an 80% jump in proportionality).
The quantitative analysis underpinning my research used Granger Causality testing to identify a true statistical causal link between this historic surge of cross-border activity and commercial real estate pricing behavior. All of the data was sourced from Real Capital Analytics and the time period of analysis was Q1 of 2002 through Q2 of 2018.
WHAT’S GOING ON HERE AND HOW CAN WE USE IT?
An obvious but important implication of these results for investors is that the lessons of one metropolitan area, or indeed the United States on aggregate, may not apply to another. While we often talk about U.S. real estate as the sum of many component markets, all too often the actions of cross-border capital investment decisions tell a different story. That is, they confuse their own individualized target markets for a “United States” investment strategy. This is a dangerous game, in that the price dynamics of any one U.S. market, or indeed any collection of markets, are very likely not reflective of what is occurring at a national level. The chart above confirms this. Accordingly, sharp investors should exercise substantial caution before drawing parallels across metros, let alone reaching the conclusion that by placing capital in a small number of U.S. markets, they have achieved exposure to a truly U.S. portfolio.
For investors placing capital in Los Angeles, San Francisco, or Washington, DC, where prices are moving in response to the volume of cross-border capital, wise operators should carefully monitor cross-border volume data and look for opportunities to “get ahead” of the price index. The causality found in the quantitative analysis naturally contains at least one lag – that is, at least a three month (but often longer) intervening period between the change in volume and change in price. Therefore, an investor in LA/SF/DC can reasonably expect reliable cross-border volume data to predict either positive or negative price movement in the following three to twelve months. This would provide a powerful tool for maximizing the value of both acquisitions and dispositions and enable investors to be more opportunistic in the timing of their transactional activity.
The New York City market presents a contrasting dynamic that discerning investors should also be able to take advantage of, though it demands a more strategic approach. Again, a three to twelve month lag in causality – but now flowing from price to cross-border volume – can be anticipated. The data overwhelmingly supports the conclusion that cross-border investors in NYC are price followers: when prices go up, they buy in within the subsequent four quarters; when prices go down, they are net sellers during that period. Equipped with this knowledge, investors in an acquisition posture should closely examine reliable NYC price indices and look for lulls in the data to predict impending periods of decreased competition from cross-border sources. Alternatively, periods of comparatively high price growth may afford an opportunity to explore transactions in alternative markets. A mirrored approach can be used on the dispositions side as well. Most critically, in a market like NYC which rarely – if ever – experiences price index decreases, the rate of price change is far more important than the absolute change itself.
CONCLUDING THOUGHTS
The results of this quantitative analysis both confirmed and called into question the preexisting strand of conventional wisdom regarding cross-border investment and prices in United States commercial real estate markets. In the four largest U.S. markets, and on a nationwide basis, there is a conclusive case for causality between these two variables. However, the direction of causality is geographically variable and should be taken into strong consideration when investors seek to assemble a nationwide U.S. portfolio. Just as importantly, the statistical strength of these results can and should be leveraged in service of more informed, shrewder real estate investment decision making.
—
ABOUT THE AUTHOR
Daniel Sibor is a 2019 graduate of the MIT Center for Real Estate.
NOTES
1 Mr. CW = Mr. Conventional Wisdom (with creative inspiration from Benjamin Graham’s The Intelligent Investor).
2 See, for example: Morris, K. (2017, March 21). Chinese Conglomerate Buys Park Avenue Building for $2.21 Billion. The Wall Street Journal. Retrieved from https://www.wsj.com.
3 Geltner, D., & van de Minne, A. (2017). Do Different Price Points Exhibit Different Investment Risk and Return in Commercial Real Estate? The Journal of Portfolio Management, 43(6), 105-119.
4 See, for example: Geltner, D., Miller, N., Clayton, J., & Eichholtz, P. (2014). Commercial Real Estate: Analysis and Investments, 2-21. Mason, OH: OnCourse Learning.
5 Using Real Capital Analytics’ Commercial Property Price Indices (CPPI) as the standard measure of price.