
A new perspective on the meaning of comps
For decades, the three things that mattered most in real estate investing were – of course – location, location, location. This is no less true today than it’s ever been. But when it comes to comps, using immediate location exclusively as a reference base for analysis gives us a very narrow way of understanding assets, and obscures crucial bigger- picture truths.
Comps, a key tool in appraising property value, performance, and potential, traditionally looks at properties within the immediate radius of an asset of similar vintage and size. Yet, commercial real estate investors have used comps in much the same way for generations and keep doing so despite the wealth of new data out there.
There’s a lot of talk lately about AI, big data, predictive analytics, and so forth. Investment capital into these fields is steadily rising across the enterprise spectrum, and even commercial real estate has seen significant investment uptick.
But integrating this tech into the core of commercial real estate business is challenging on a deeply infrastructural level. Which begs the question: when it comes to real estate investment, why forge into the great digital unknown, when commercial real estate – by far the strongest asset class on the planet – is doing just fine as it is?
Here’s why.
SEQUENCING PROPERTY DNA
To gauge someone’s potential health problems and life expectancy, you’d probably take a simple physical, a blood test, ask about his or her medical history, maybe even inquire about the medical history of their family members and try to evaluate the effect of environmental risk factors. But if you wanted an in-depth look at that person’s health profile and susceptibility to major ailments, you wouldn’t stop there – not in the era of genome mapping and DNA sequencing.
When we look at the condition of commercial real estate assets, the same principle applies in our era of advanced AI technology. Just as the mapping of the human genome offered unparalleled insight into individual health, predictive analytics and artificial intelligence can help sequence property DNA. Decoding the mechanics that govern the market brings unprecedented accuracy to the property comparison process, unlocking once-invisible insights to deliver untapped value to investors.
ARE TRADITIONAL ANALYSES IGNORING CRUCIAL DATA?
Traditional data sources like rent, occupancy, demographics, employment, and cap rates serve as the main ingredients in real estate analysis and will remain relevant forever. But today’s technology allows penetrative data insights to compare assets at a much larger scale and yield far more information. Consider the insights that can be generated when you aggregate traditional asset data with new data sources like Street View images, social media, cellular data, satellite imagery, clickstream data, advertising campaigns, news trends, topological maps, and geospatial data.
Where legacy analysis methods reach their limits, new tech-based data exploration keeps going – generating previously unheard-of insights in speed, data-crunching power, and accuracy. With this ocean of information, there emerges an astonishingly accurate ability to document trends, obtain insights, and make predictions.
Comps, as we think of them traditionally, ignore a wealth of relevant data outside arbitrarily defined constraints. To elaborate with just one example on how expansive the new data-driven approach to comps can be, consider rent rate analysis. What if, instead of looking at the vintage and unit mix of similar buildings in a given submarket, we broaden our pool of comparisons by examining the very comparisons being made by the potential tenants themselves? This is now possible thanks to clickstream analysis. This web browsing data tells us exactly which assets potential tenants are comparing in their own searches, providing previously unavailable insight into which parameters they are focusing on.
But this is only a hint of what’s possible. The maturation of machine learning and sheer processing power are continually enhancing our capacity for a data-driven ‘bird’s-eye view’. This enables ever-broadening ways to generate even more insightful comparisons for predicting asset value and performance.
Today’s technology allows penetrative data insights to compare assets at a much larger scale and yield far more information.
EVERYTHING IS RELEVANT
The days of focusing exclusively on assets of similar grade and age within predefined geographical areas are over. The new peer group of relevant comps is much more extensive and is based on myriad deep-data points culled from wide-scope trends – even across the entire continent.
Utilizing both supervised and unsupervised learning, algorithms enable data science teams to design and train an ensemble of machine learning models. These models form what could be called “virtual neighborhoods” – clusters of properties deemed similar according to thousands of different signals in the data, some of which are represented by deeply hidden correlations. After analyzing each data point for its relative importance, this information can then be used to construct an incredibly precise schema of the real estate asset in question.
Going back to our DNA analogy, this means that instead of looking to external local factors for actionable information on the asset in question, we employ penetrative AI-based analyses far more comprehensive than conventional comp models to understand the relative importance of every single
data point. This way of understanding the market also enables trend predictions on an unprecedented scale. Finally, the idea of huge-picture market assessment has become a reality.
NON-SCIENTIFIC APPROACH TO COMPS CAN LEAD US ASTRAY
Let’s look at an example. Using a classic comp analysis, an experienced human real estate analyst would source the usual comps and compare a couple of dozen similar assets. Here’s how that looks when applied to a particular property in Atlanta: This chart shows us where on the rent scale our property is located compared to its peer group when looking at rent per square foot vs. year built, using a grid system showing us the location of our property (the yellow dot) vs. its peer group (the blue dots).
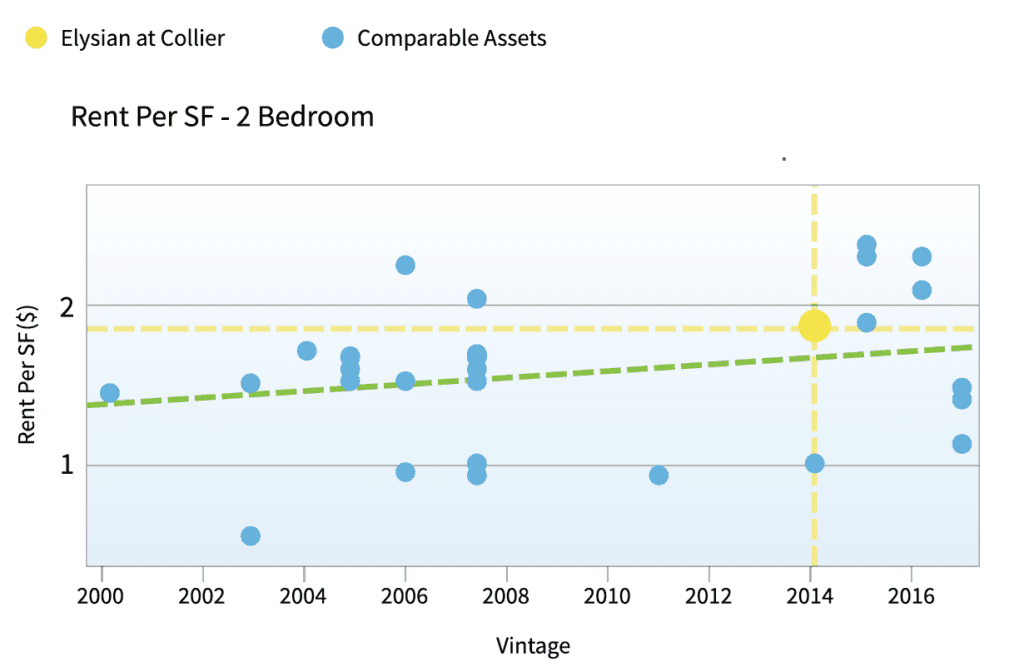
Following a traditional comp analysis by leveraging linear regression and the resulting prediction, one may conclude that the asset is a bit more expensive than its average peer. But is that really the case?
When the same asset was analyzed using AI to widen our MSA (measurable statistical area) and compare dozens of additional assets (thus expanding our statistical pool for much more precise results), the conclusion reached was fundamentally different.
The asset that initially seemed expensive to rent was actually under-occupied. Relying on conventional analyses would have led investors to make the wrong decision, based on nothing more than a statistical fallacy – easily correctable when using upgraded analytics tools. The ramifications for bottom line in this and many other cases are enormous.
Comps, as we use them now, frequently rely on a statistical sample too insignificant or non-representative of the asset in question. If we choose too small a group or the wrong set of comparables, we may fail to precisely pinpoint an asset’s true value – let alone make accurate predictions. In other words, the comp groups we tend to use are often not large enough to be truly representative or erroneously include altogether irrelevant comps, leading to inevitable analytical swings and misses. Until now, these comperables were all we had to work with – but big data and machine learning now allow us to generate statistically precise insights and predictions on any asset or group of assets, while ensuring that they are all inter-competitively relevant.
A COMPLETE MARKET PICTURE EMERGES
Looking at bigger-picture data analysis, ZIP Codes, MSAs, and even entire states can become deeply comprehensible when we have the right tools.
By analyzing MSAs or ZIP Codes with data similarities to regions that have dramatically heated up or cooled down in the past, predictions can be made regarding the seriousness of our region’s fluctuations, whether or not they’ll be sustained, and essentially, if it’s worth investing in or holding onto.
This ability to identify past patterns as a way of finding future probability on a mass scale is unprecedented. Until recently, the data processing required for these types of analyses was far beyond the scope of human ability, or any computational capacity. This is no longer the case.
HUMAN EXPERTISE MEETS ARTIFICIAL INTELLIGENCE
When human analysts are armed with sophisticated technology, new deal parameters will be incontestably illuminated and new value unleashed. There is no substitute for experienced human asset managers – and their expertise, when fused with AI, will become even more crucial. But as long as commercial real estate research and acquisitions are still carried out using mainly Excel spreadsheets and siloed data sources, commercial real estate investment capabilities will not be performing at their full potential.
It’s now possible to offer a superior ability to assess investments and perform predictions. When you combine traditional data with new types of data that are made possible for analysis with AI, you get a whole that is greater than the sum of its parts.
So yes, “location, location, location”, is certainly still relevant. But going forward, the fundamental real estate maxim might just become “data, data, data” – as deep data insights with a scope far beyond immediate environment as their prime analytical focus reign supreme, changing the rules of the game – and unlocking billions of dollars in value.
—
ABOUT THE AUTHOR
Guy Zipori is the Co-Founder and CEO of Skyline AI, a real estate investment technology company headquartered in New York.