
Is the next generation redefining US real estate?
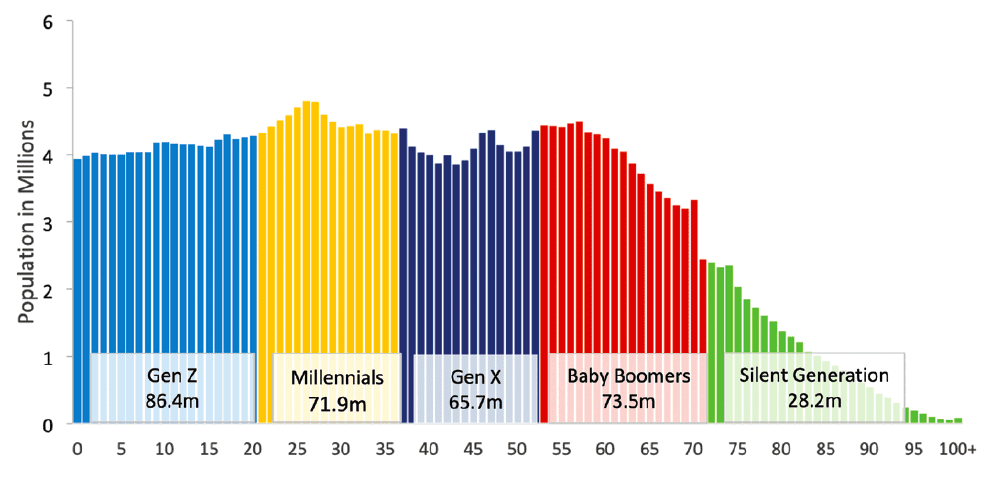
The millennial generation has grown up. As defined by Pew Research, millennials include those born between 1981 and 1996, making the youngest of the age cohort 23 years in 2019 and the oldest 38. Applying this definition to the most recent full set of population data shows that the millennial population was approximately 72 million in size in 2017. At the same time, the five largest one-year groups all fell between 24 and 28 years old.1 Millennials are a force to be reckoned with.
In this article, we show the impact of millennials on the dispersion of economic growth across the top 50 US metro areas and discuss implications for commercial real estate investors. We find that the metro areas with stronger growth in millennial population have stronger employment growth as well. Job availability is likely attracting maturing millennials and their arrival is likely generating further job growth. At the same time, metro areas attracting disproportionate flows of millennials have less affordable homes and the highest rents, but not disproportionately higher median incomes. Altogether, these characteristics offer the opportunity for commercial real estate investors to follow the path of millennial population growth. At the same time, a different kind of opportunity and caveats exist in localities relatively less attractive to millennials. Investors are well-advised to consider both.
DIGGING INTO DATA
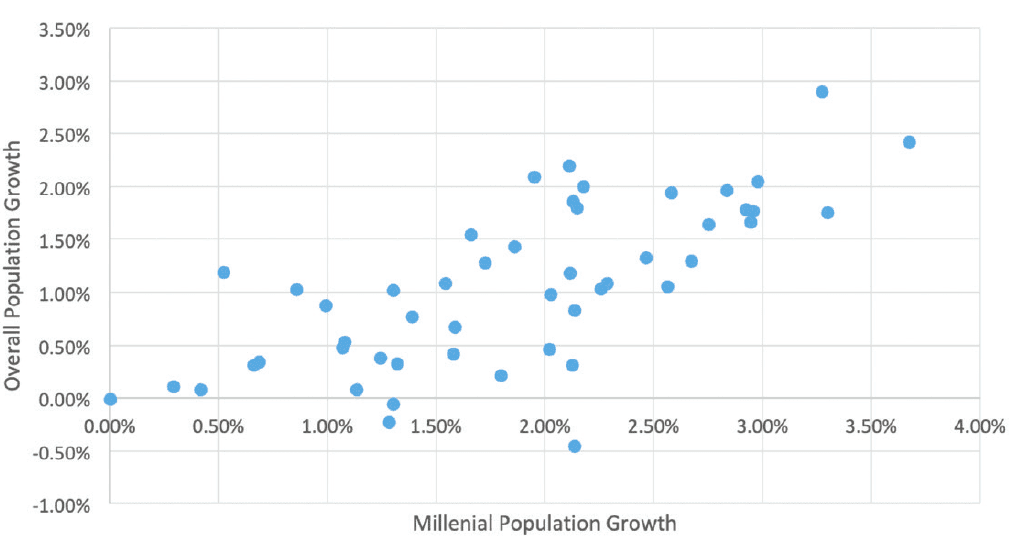
The top 50 metro areas range from New York with 14.5 million people to West Palm Beach with just 1.5 million; together they comprised 49% of the US population in 2017, the most recent year for detailed data. Over the five years ending in 2017, the top 50 metros have enjoyed a 1.1% rate of population growth, sharply stronger than the 0.7% national rate. Within the top 50, population growth ranged from a high of 2.9% per year for Austin to a low of -0.5% for Detroit. Interestingly, growth in millennial population appears to be a driver of overall population growth as shown in Exhibit 2. The top ten metros for millennial population growth also enjoyed relatively stronger overall population growth, 1.9% per year versus 0.8% for the remaining 40 metros.2
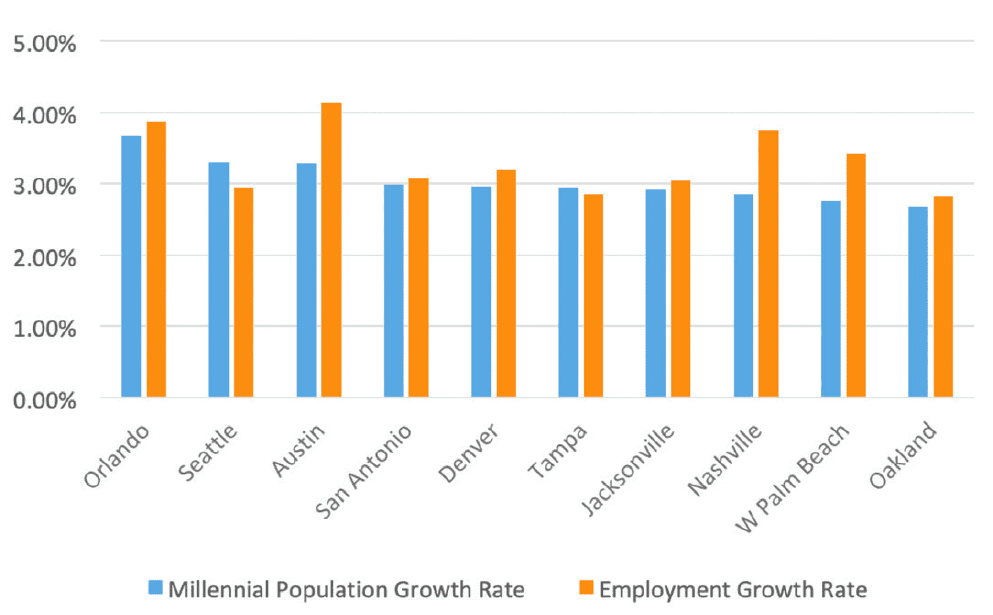
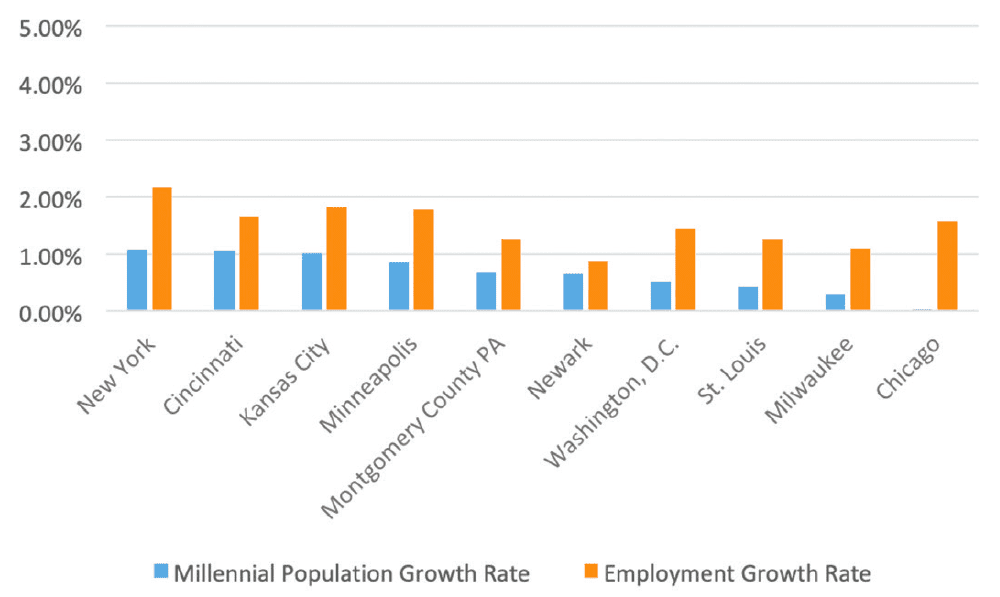
Employment growth disparity is similar. Over the five years ending in 2017, the pace of job growth in the top 50 metros averaged 2.3% annually with Riverside, California number one at 4.2% and Pittsburgh number 50 at 0.3%. For the ten metros with the strongest millennial population growth, employment growth was sharply higher; 3.3% per year versus 1.5% for the ten slowest as shown in Exhibits 3 and 4.3,4
WHAT ABOUT INCOME?
The impact of millennials on income does not follow the same pattern. Median income in the ten metros with the strongest growth in millennial population is $65,092, lower than the $67,425 in the remaining 40 metros. At the same time, median gross rent is 3% higher in those top 10 millennial-attracting metros and single-family home affordability is 15% tighter.3, 4
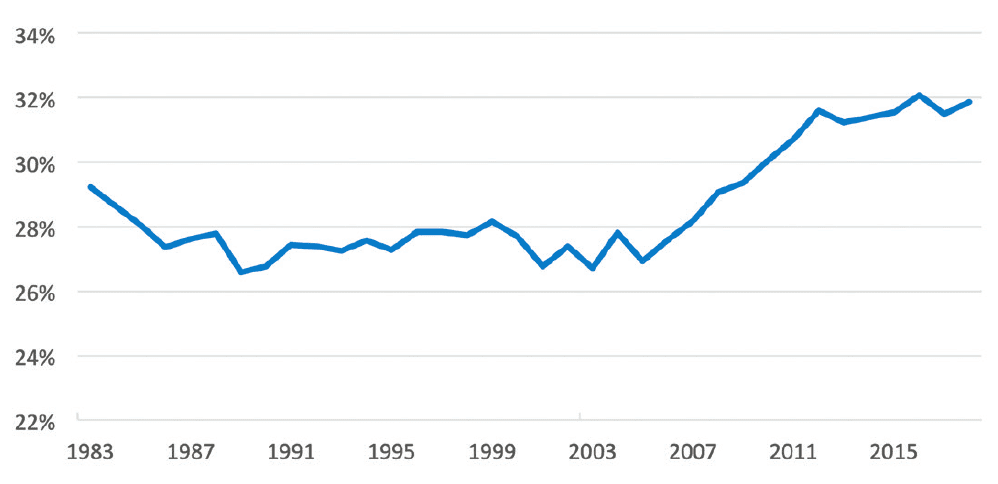
The relatively higher rents in the metros attracting millennials exacerbates the affordability constraints unique to the generation. According to the Federal Reserve’s Survey of Consumer Finances, 45% of millennial households have education debt averaging $18,500 and 39% have auto loans averaging $12,700.5 This debt burden helps to explain the low rate of homeownership among millennials; a recent Brookings study estimates that only 39% of 25-to 34-year-olds were homeowners in 2015. The debt burden might also explain delayed marriage and child-bearing as well as prolonged living with parents (Exhibit 5).6 When combined with the tightening in home mortgage lending standards after the 2008 crash, it is no wonder that millennials are more likely to be renters than homeowners.
CHALLENGES FOR COMMERCIAL REAL ESTATE INVESTORS
The clearest conclusion offered by this short analysis is that property investment opportunity is likely to be most concentrated in the metro areas that have relatively stronger growth in millennial population accompanied by relatively stronger overall population growth. This conclusion is reinforced in rent growth data showing that the top 10 metros ranked by 5-year millennial population growth also produced stronger 5-year rent growth for all four major property sectors: apartment, industrial, office, and retail.7
These millennial-attracting metros will need supply of new space covering every property type. The challenge, however, is to align the new space with the needs and preferences of a growing population, especially the growing millennial population. This challenge affects both investors in property as well as commercial mortgage lenders.
As noted in the data, the metros with the strongest growth in millennial population are not generating drastically higher median incomes. Surprisingly few millennials are high wage “tech” workers. Even in the Bay Area which has the highest concentration of tech employees, they comprise only 10% of total employment, according to CBRE.8 With modest earning power and sizeable debt burdens, millennials need apartments with lower rents than is common for Class A new construction. This translates into opportunities for renovation of existing stock, repurposing of other property types such as obsolete retail, and innovation in design and delivery of new stock.
Retail property also offers opportunities in expanding metros but the old rules of thumb no longer apply. Online grocery shopping with home delivery is compressing the need for old fashioned supermarkets and replacing it with demand for fewer stores, serving larger populations, with add-on features such as cafes, cooking classes, demo areas, and pop-up specialty nodes.
Metros with slow or negative overall population growth and relatively weak millennial population growth present different challenges for commercial real estate investors. For those with existing portfolios of properties and/or commercial mortgages, careful monitoring of market demand is crucial. We believe many neighborhoods will continue to prosper even as the larger metros shrink. These neighborhoods may offer opportunities for new construction, perhaps targeted to aging demographics. Affordability may be an issue in these areas as well, particularly as retiring baby boomers downsize and economize. Repurposing existing obsolete properties to create senior housing, assisted living and medical office might also be advantageous.
Other neighborhoods in these weaker metros may lose vitality which threatens ongoing occupancy. In these neighborhoods, owners might respond by defensively extending leases to stronger tenants even at the cost of extra concessions. This strategy will also require careful attention to property operating expenses and capital spending. Lenders do not have these powers but can encourage borrowers to recognize the reality of weakening demographics and adjust accordingly.
Commercial real estate investors are familiar with the eternal motto: “location, location, location.” We hope to replace it with “Demographics first!”
—
ABOUT THE AUTHOR
Martha Peyton is Managing Director of Applied Research for Aegon Real Assets US. Aegon Real Assets US is an indirect wholly owned subsidiary of Aegon N.V.; is a US-based investment adviser registered with the Securities and Exchange Commission (SEC); and part of Aegon Asset Management, the global investment management brand of Aegon Group.
NOTES
1 Source: US Census, American FactFinder
2 Source: US Census Bureau (2012-2017)
3 Source: Bureau of Labor Statistics, US Census Bureau (2012-2017)
4 Source: Bureau of Labor Statistics, US Census Bureau (2012-2017)
5 2016 Survey of Consumer Finances, 1989-2016 surveys
6 Source: US Census Bureau, 1983-2018
7 CoStar Realty Information, Inc.
8 CBRE Research, 2018 Scoring Tech Talent
DISCLOSURE
This material is intended only for sophisticated and experienced investors. The information included in this document should not be construed as investment advice regarding any security, a recommendation for the purchase or sale of any security, or an offer to sell or solicitation of an offer to purchase any security. Such offer or solicitation may be made only upon delivery and an investor’s consideration of the governing fund documents which discuss in detail all material aspects of the investment opportunity, including pertinent risk factors. The enclosed information has been developed internally and/or obtained from sources believed to be reliable; however, Aegon Real Assets US does not guarantee the accuracy, adequacy, or completeness of such information. This material contains general information only on investment matters; it should not be considered as a comprehensive statement on any matter and should not be relied on as such. The information it contains does not take into account any investor’s investment objectives, particular needs or financial situation. The value of any investment may fluctuate. Results achieved in the past are no guarantee of future results. Proposed terms are a summary in nature and are not complete. These terms may change materially at any time. This material contains current opinions of the manager and such opinions are subject to change without notice. Aegon Real Assets is under no obligation, expressed or implied, to update the material contained herein. If there is any conflict between the enclosed information and Aegon Real Assets US’ Form ADV, the Form ADV controls. Nothing in this material constitutes investment, legal, accounting or tax advice, or a representation that any investment or strategy is suitable or appropriate to you. This document includes projections or other forward-looking statements regarding future events, targets, intentions or expectations. Due to various risks and uncertainties, actual events or results may differ materially from those reflected or contemplated in such forward-looking statements. There is no guarantee that projected returns or risk assumptions will be realized or that an investment strategy will be successful. No representation, warranty or undertaking is made as to the reasonableness of the assumptions made herein or that all assumptions made herein have been stated. No part of this material may be reproduced in any form, or referred to in any other publication, without express written consent of Aegon Real Assets US, 6300 C Street SW, Cedar Rapids, IA 52499.