WHY IT’S IMPORTANT FOR INVESTORS TO FIND WAYS TO CALCULATE POLITICAL RISK IN CITIES – ESPECIALLY NOW.
When allocating capital, investors focus most of their efforts on analyzing economic growth and real estate fundamentals. An often overlooked point of analysis is political risk, although a metro’s governance has clear implications for real estate investors.
In other words, policy counts. Metro-level growth patterns in the US have shifted over time, driven by economic and social factors. Although some of these trends are baked in by history and geography, key economic drivers such as housing, education, taxes, infrastructure, and zoning are directly affected by policy choices. This is why it is important for investors to fi nd ways to understand political risk.
At this point, the popular opinion often says, “keep politics out of research.” However, there are clear differences in policies between cities, states, and regions that can impact the outlook or investors—and there needs to be a way to map these differences.
DEVELOPING A NEW POLITICAL RISK MATRIX
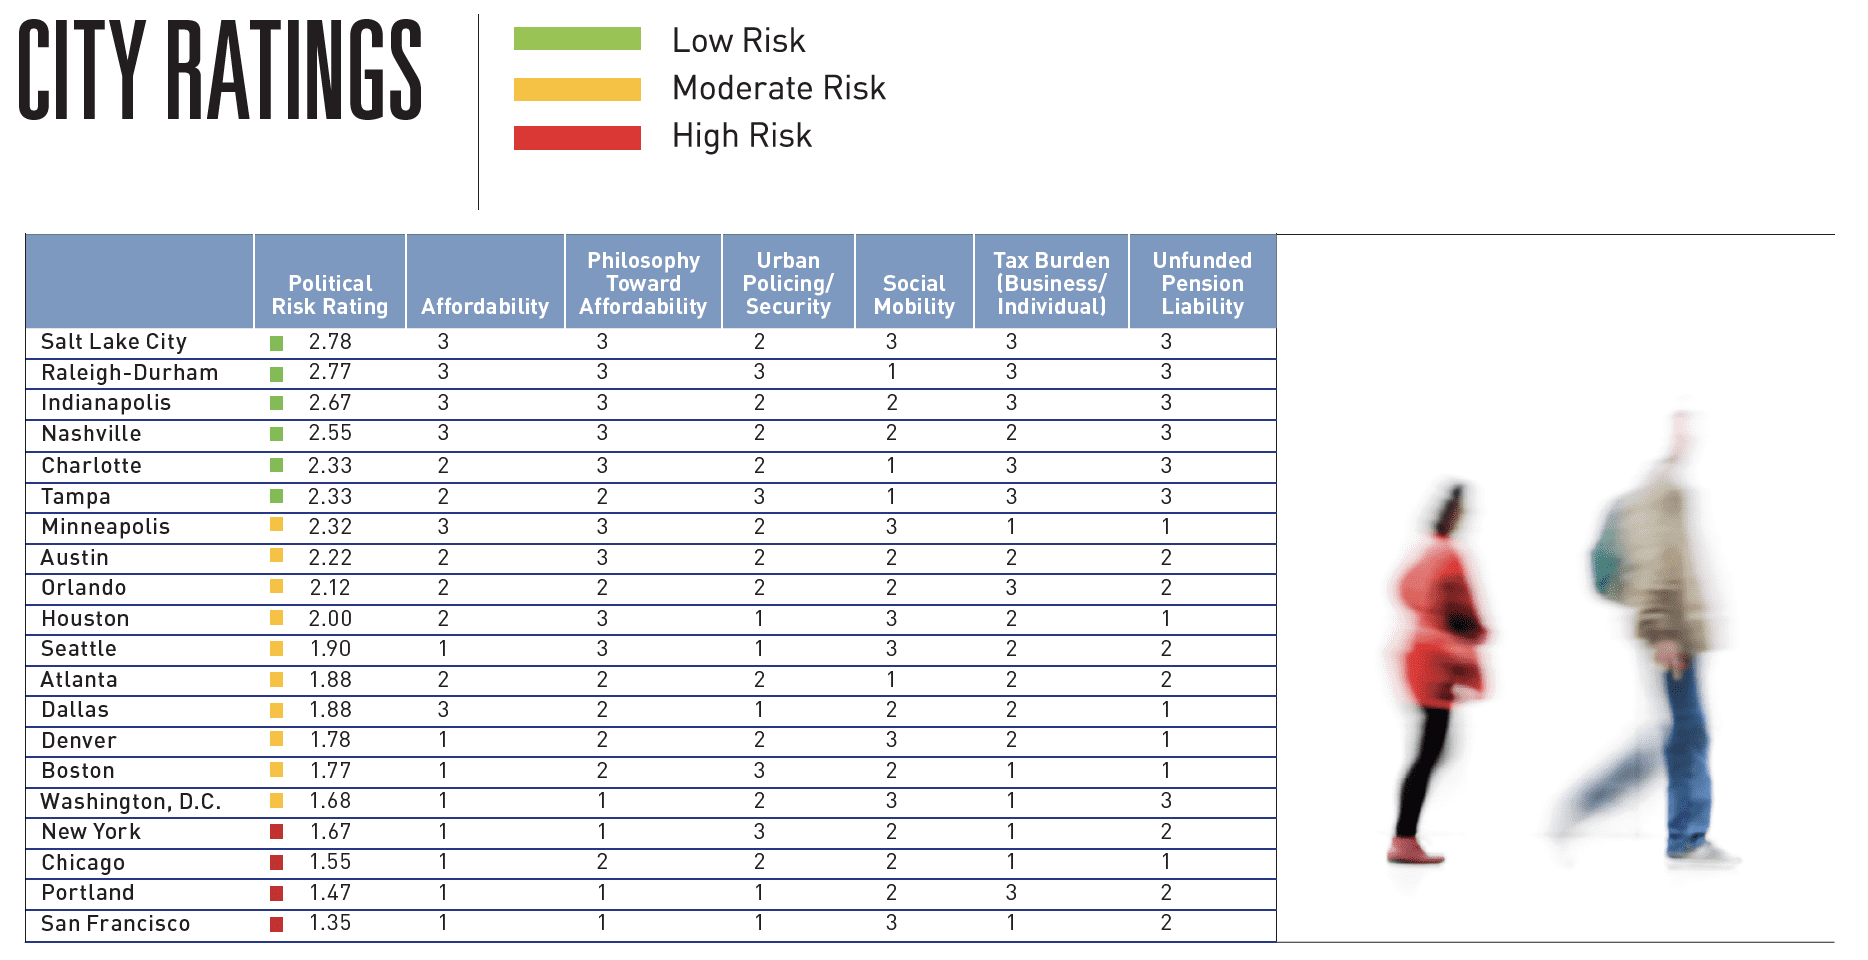
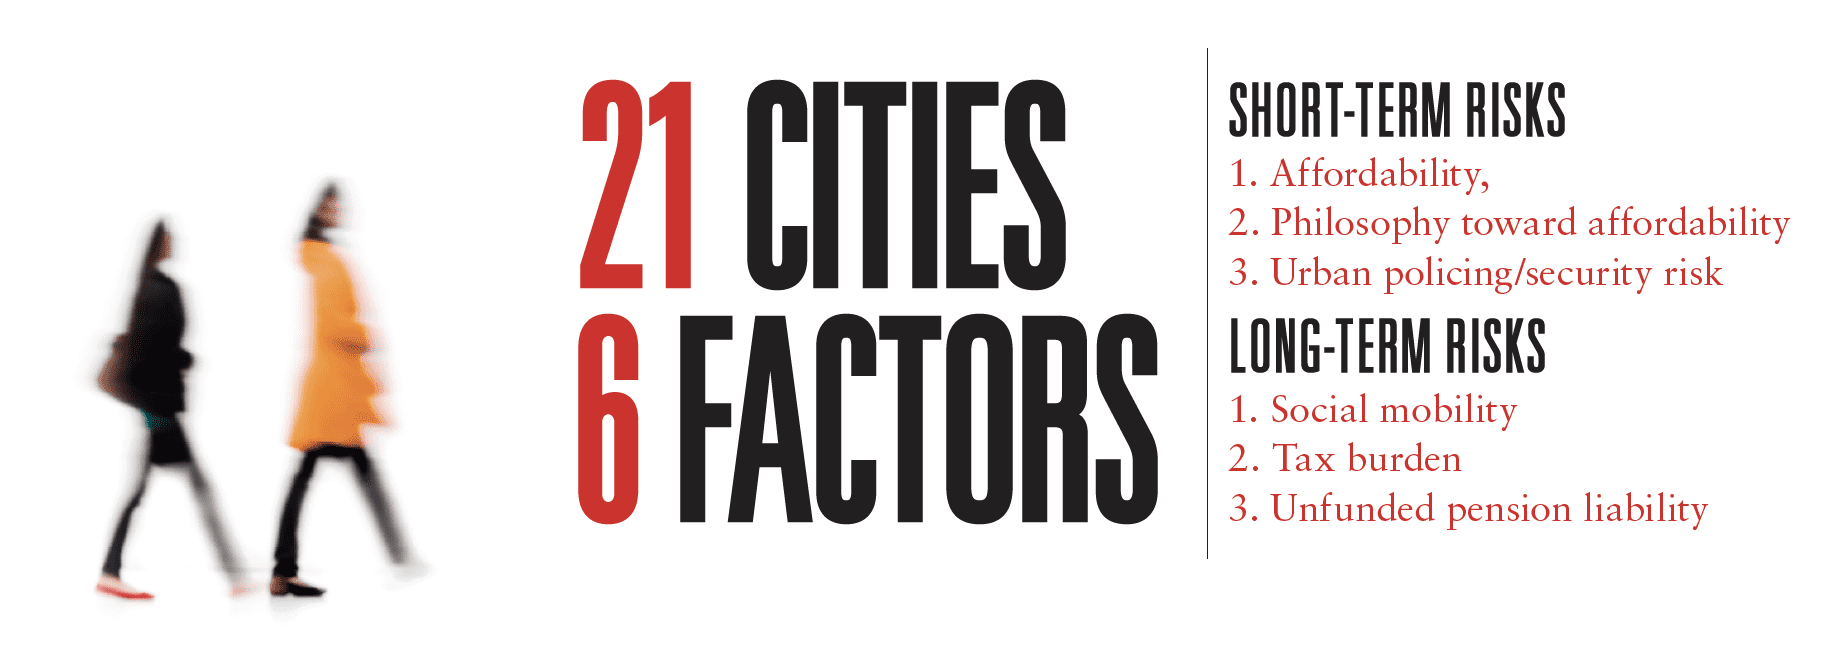
To analyze the subject of political risk, we created a ranking system of 21 major metros using six categories we consider important in determining future political risk. Three of the categories we categorize to be short-term risks (affordability, philosophy toward affordability, and urban policing/security risk); the other three factors (social mobility, tax burden, and unfunded pension liability) are long-term risks. In assigning scores to these factors, we considered a mix of data and anecdotal/policy dynamics that we believe will impact investment performance.
AFFORDABILITY
As companies and individuals become more mobile, the cost of housing becomes an increasingly important element of growth. We can see this with technology companies creating outposts in secondary and tertiary metros because there isn’t enough appropriately priced housing for workers in major tech markets such as San Francisco and Seattle. Large metros including Chicago, New York, and areas throughout California have a net out-migration of residents leaving for states with lower housing costs, such as Texas and Florida. Metros including Dallas, Atlanta, and Phoenix have taken advantage of this outflow to attract corporate relocations.
PHILOSOPHY TOWARDS AFFORDABILITY
While affordability covers mostly statistical measures, the philosophy metric involves more policy-oriented issues encompassing rent control initiatives, exclusionary/ inclusionary zoning regulations, permitting and entitlement requirements, and supply restrictions within each market. Metros that encourage housing construction or offer incentives to increase affordable housing development are responding to a need that will create an environment favorable for growth. Alternately, metros that make it difficult to respond to the demand for affordable housing—for example, by enacting rent control—are less likely to produce strong growth.
URBAN POLICING/SECURITY
Our ratings are based on crime statistics from 1977 to 2017 from Moody’s Analytics and the US Federal Bureau of Investigation, as well as secondary research on the overall landscape of local urban policing and security risk. The stats include the number of property and violent crimes per capita and a crime index that considers both types of crime. We also factored in secondary research around several elements that can impact a market, including police enforcement and prosecution of public nuisances and low-level crimes, the public reputation of the city’s police force, and local policies regarding homelessness (which tends to involve a high rate of drug addiction and mental illness, and is a growing quality-of-life problem in many cities).
SOCIAL MOBILITY
Metros have a better chance of outperforming if they have policies that enable individuals to succeed, even if they come from impoverished backgrounds. The overall rating in this category incorporates data from “The Opportunity Atlas,” prepared by Opportunity Insights, a research and policy group at Harvard University. The study followed 20 million Americans born between 1978 and 1983 from childhood to their mid-30s to determine which neighborhoods in America offer children the best chance to rise out of poverty. The social mobility data provided by the Opportunity Atlas for children from low-income families was used as the primary source for our Social Mobility rating in each market, and we also factored in secondary research on the availability of local educational opportunities that included charter school enrollment, the number of advanced placement (AP) courses in each city’s public high schools, as well as apprenticeship opportunities and tech-based curricula in public-school programs.
TAX BURDEN (Business/Individual)
The tax burden scores took into consideration a market’s income and its sales, corporate, property, and unemployment insurance taxes for both individuals and businesses. We used the state rank score of each market from the Tax Foundation’s 2019 State Business Tax Climate Index, which compares US states on 118 variables in five major areas of taxation and combines these results to generate an overall ranking score for each state.
The correlation between tax rates and economic growth is hotly debated, and taxes are merely one component of larger economic decisions. The largest and most liquid primary markets are among the most highly taxed and they have performed well over time. However, real estate taxes are an increasing burden for many property owners, and the 2017 federal tax law’s elimination of the state and local income tax deduction has exacerbated the disparity in housing costs between states, which could spur an exodus of households to lower-tax metros.
UNFUNDED PENSION LIABILITY
Our score for this metric is based on the pension liability at the city and state level. Data on each state’s unfunded pension liability was collected from “The State Pension Funding Gap: 2017,” an issue brief written by the Pew Charitable Trusts. The state pension plan data collected for each of the markets’ states included plan net position, total pension liability, and the funded ratio. Metros that have large unfunded obligations may be hit with big payments that could force them to increase taxes steeply and/ or leave them unable to fund important programs such as affordable housing or infrastructure.
BUILD YOUR OWN SYSTEM
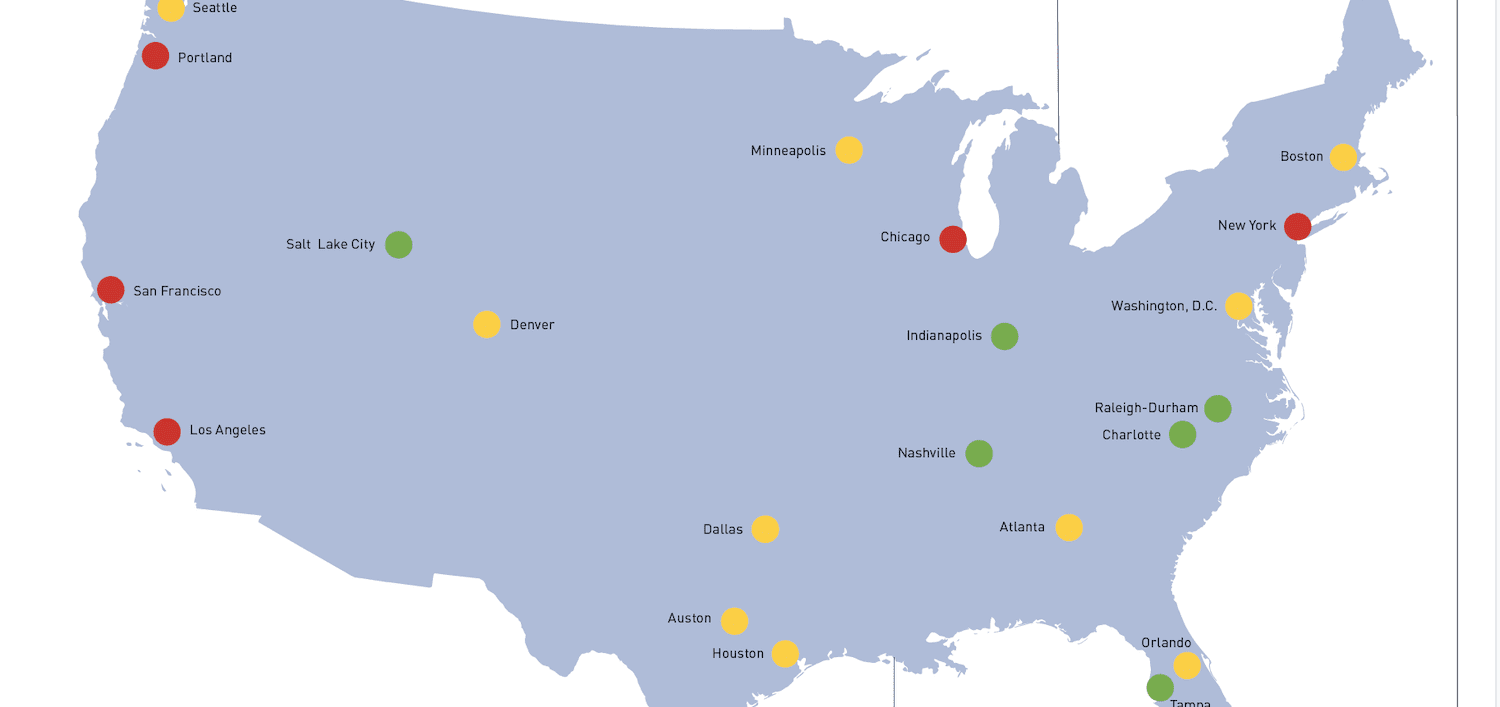
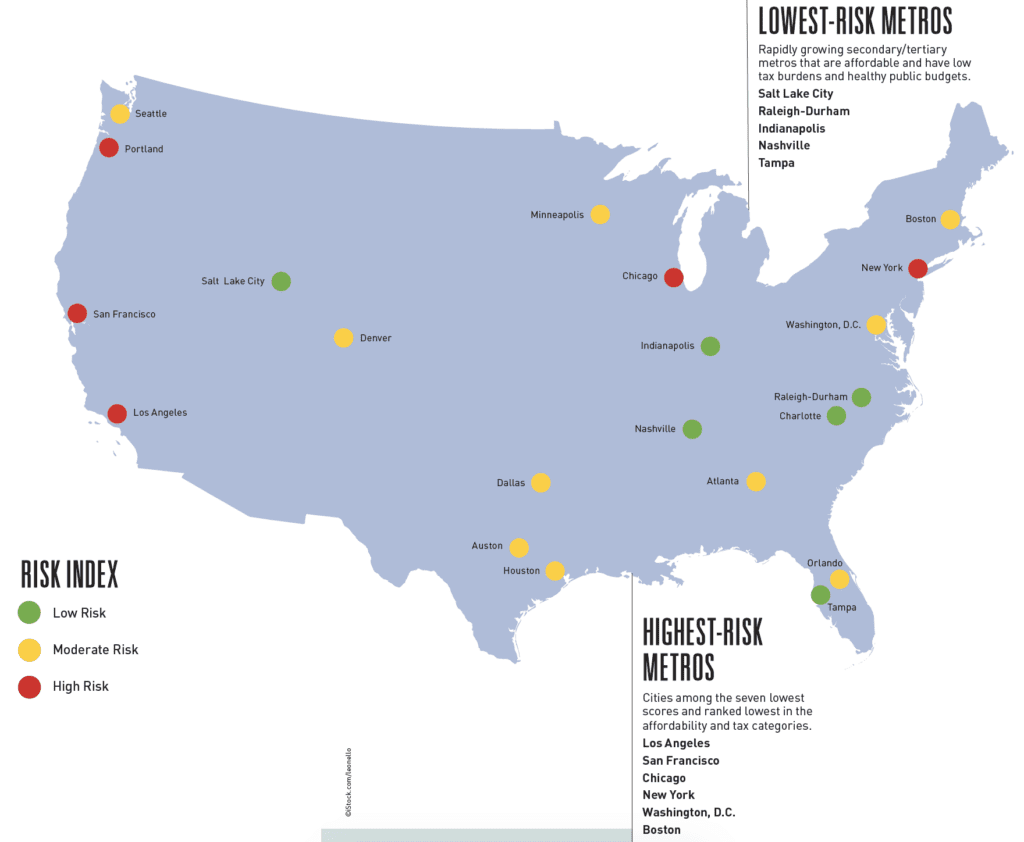
Our top scores were awarded to Salt Lake City, Raleigh-Durham, Indianapolis, Nashville, and Tampa— rapidly growing secondary/tertiary metros that are affordable and have low tax burdens and healthy public budgets. Meanwhile, the six “primary” real estate markets—Los Angeles, San Francisco, Chicago, New York, Washington, D.C., and Boston—were among the seven lowest scores and ranked lowest in the affordability and tax categories. Nonetheless, primary markets remain the largest and most liquid, and they have performed well over time.
Because our analysis is merely a framework and a work-in-progress, and should in no way be construed as a recommendation for or against any markets, we believe there is opportunity to develop an even deeper understanding of political risk by including additional factors, such as:
INFRASTRUCTURE
Airports, highways, bridges, and rail lines can be drivers of growth. There are various plans (both public and private) to build high-speed train routes between population centers—examples include San Francisco to Los Angeles, Houston to Dallas, Southern California to Las Vegas, and Portland to Vancouver, B.C.—with potential for economic impact on those regions. Many cities have bridges, tunnels, roadways, water and electric systems, and other utilities that need repair. Some fast-growing metros are finding that their highway and public transportation systems are inadequate, and housing costs are rising much more rapidly than expected. The lifestyle conditions that helped attract growth could disappear without smart planning and increased resources for infrastructure.
ENVIRONMENTAL, SOCIAL, AND GOVERNANCE (ESG)
Some investors are concerned with issues that involve the environment and equality, and prioritize stated ESG principles. For example, scientists forecast that as polar ice caps melt, ocean levels will rise and force coastal cities to implement plans to deal with potential water encroachment. Alternately, gender equality in the workforce is an important element of growth as more women graduate from college than men and become a larger part of the corporate world.
IMMIGRATION
The birth rate of native-born households has fallen below the level needed to maintain the US population without immigration. Most of the major urban centers in America are seeing an outmigration of domestic residents but are relying on immigration to fill jobs and create growth. It’s not just cities; immigrants are also reviving some rural areas that have dwindled as a result of plant closings or other economic hardships.
DON’T IGNORE THE ELEPHANT IN THE ROOM
This article is not meant to be a final word on the subject. It’s not even our last word as authors and researchers. We plan on expanding our study to more metros, and will include a section on climate change. Additionally, a diversity of policies can be found within each metro for the issues we highlighted (for example, municipalities within the same metro often have varying zoning policies). Finally, policy isn’t science– data, correlation, and causation can be debated, and investors are likely to have different views as to what constitutes effective governance. We also understand that there is a risk inherent in any policy discussion. A reader could potentially find cause to disagree with at least a part of our analysis, but because political risk is often overlooked in commercial real estate, our goal is to generate conversation. Beyond differences opinion, the bottom line is that investors should not ignore the impact of policy when making portfolio-level allocations or underwriting deals.
—
ABOUT THE AUTHORS
Jeff Adler, Paul Fiorilla, and Madeline Winship are leaders at Yardi® Matrix, which offers the industry’s most comprehensive market intelligence service for multifamily, office, self-storage, and vacant land properties. Learn more at yardimatrix.com.
NOTES
This article and its analysis is explicitly designed for institutions investing in the continental US and is designed as a framework and a work in progress. Readers may have different views on the relevance and weighting of the factors described. All such discrepancies are exclusively attributable to the authors.
In its focus on an often-controversial list of metrics, there is a clear need to evaluate metro-area risk just as one would evaluate country risk. Approaching this topic is fraught with risk. We were initially reluctant to even take up the issue, yet our clients urged us to try. An area of high political risk is not necessarily one that we might demur from investing in; neither is a market with low political risk necessarily one that comprises a good investment. The goal of this analytical framework is to explicitly consider the factor and be compensated for the risk.
The analysis was done—and article was written—before the coronavirus entered the US, before “social distancing” was a term and well before large portions of the country were forced to quarantine. Our crystal ball was not clear enough to incorporate pandemics as a metric. At the same time, however one feels about the responses to the pandemic by various government actors, it illustrates the basic point of the article: policy and governance are critical to the economy and the performance of metros.
THIS ARTICLE ORIGINALLY APPEARED IN SUMMIT (SPRING 2020)
—