
When it comes to market and asset selection, greater availability of property-level operational data and sophisticated tools to measure, analyze, and predict it (including AI) can help address key questions.
In the environment of rising cap rates, growth in net operating income (NOI) is a key driver of property value and ultimately overall investment return. NOI growth is, in turn, a function of growth in revenues and expenses, whose respective impacts determine and explain variation in operational performance across geographic markets, multifamily subtypes, and individual assets.
Historically, much of real estate research focused on analyzing the revenue side of the NOI equation while the expense side was more of an afterthought. Both property valuations and underwriting pro formas often simply assume that over a typical holding period, operating expenses tend to keep up with consumer price inflation, or more simply just average 3-4%.
But the reality is quite different.
For example, in the case of higher-quality institutional-grade apartment properties in NCREIF portfolios, same-store expense growth has exceeded inflation over the last five-, ten-, fifteen-, and twenty-year periods. Similar dynamics can be observed in the much broader universe of properties captured by multifamily CMBS data. Moreover, average expense growth was slightly ahead of revenues over the last five years, and it appears this will also be the case in 2023 and potentially the first half of 2024. This will put pressure on NOI growth and margins, and we see from the data that the impact varies widely across markets, subtypes, and assets.
LEANING ON HISTORICAL ANALYSIS
Both the headline numbers and these wide variations are essential to consider when underwriting future expense growth. Investors should also pay close attention to the expense loads and performance across the various operating statement line-items (i.e., taxes, payroll, utilities, maintenance, insurance etc.). Each of these line-items have their own specific drivers and in aggregate determine the total expense load, growth, and the subsequent impact on NOI.
As revenue growth slows in the near-term, property owners’ ability to control and reduce expenses becomes a key differentiator in achieving pro forma assumptions and ultimately cushioning the impact of higher interest rates on property values. The first step to effectively managing various risks associated with expenses is measuring their magnitudes and variation of its impacts across markets, subtypes, and individual assets. This understanding of historical trends is the essential starting point for investors and asset managers for benchmarking individual property performance, establishing more informed and realistic budgets and underwriting assumptions when making buy/sell decisions.
Why is historical trends analysis key to all this? Consider this question when managing your 401K. Suppose your financial advisor did not know long-term total returns on stocks, or historical magnitudes of annual changes, or how growth stocks perform relative to dividend stocks, and so forth. How could you possibly make good investment decisions without this knowledge? You would be lost!
The same logic applies to property investment. What were property investment returns in the past? How did they vary over a multi-year holding period—and why? How much do location and property characteristics impact this variation? Historical performance helps shed light on these and other considerations which provide the foundation for constructing a coherent investment plan, even things as basic as how much it typically costs to run a typical property in each market.
PERSISTENT EXPENSE PRESSURE IN 2023
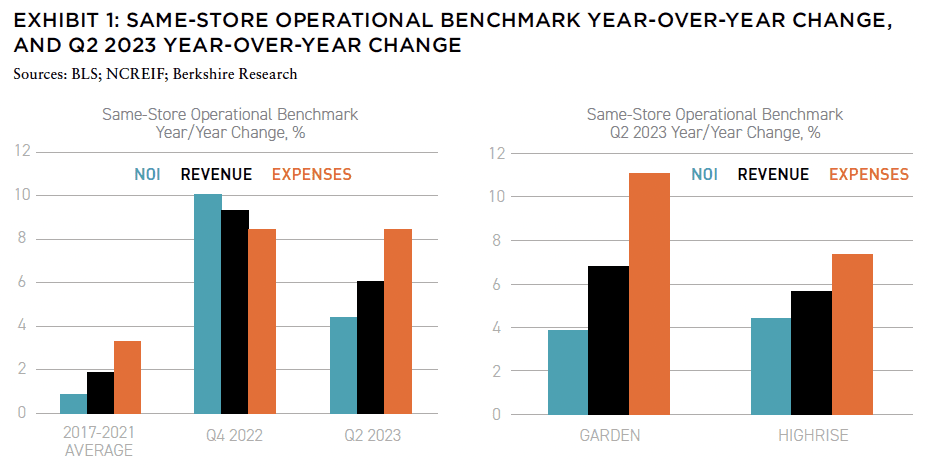
The usually boring subject of expenses started to get more attention in 2022 as the economy was experiencing the highest inflation in forty years. While much of the attention focused on unprecedented apartment revenue growth, expenses grew even faster, and this pattern has become even more pronounced in 2023 as market fundamentals moderated substantially at the same time as cost pressures edged even higher.
The good news is that as broader inflation moderates, expenses will likely follow – but that might take some time. The major expense categories such as taxes and payroll are still accelerating, even though their rates of growth may not be as high compared to a much smaller category, such as insurance, which already increased by more than 30% in 2023, more than doubling the pace of 2022 and the five-year trailing average.
This acceleration in expense growth in 2023 is a broad-based trend nationally, but there remains a wide variation across geographic markets and multifamily subtypes. For example, year-over-year expense growth for institutionally owned garden apartments is about 11% compared to 7% for high-rise properties, which helps explain why the latter segment is now slightly ahead in terms of NOI growth, even as it still lags on revenues.
Regionally, expense momentum remains more pronounced across the Sunbelt region, which was already leading this trend last year. Expenses are up about 15% year-over-year in Florida markets from about 9% in 2022 due to outsized increases not only in insurance but also taxes and property management/maintenance. In general, areas with tighter labor market conditions are seeing the dual impact as higher wage growth boosts not only rents but also payroll costs.
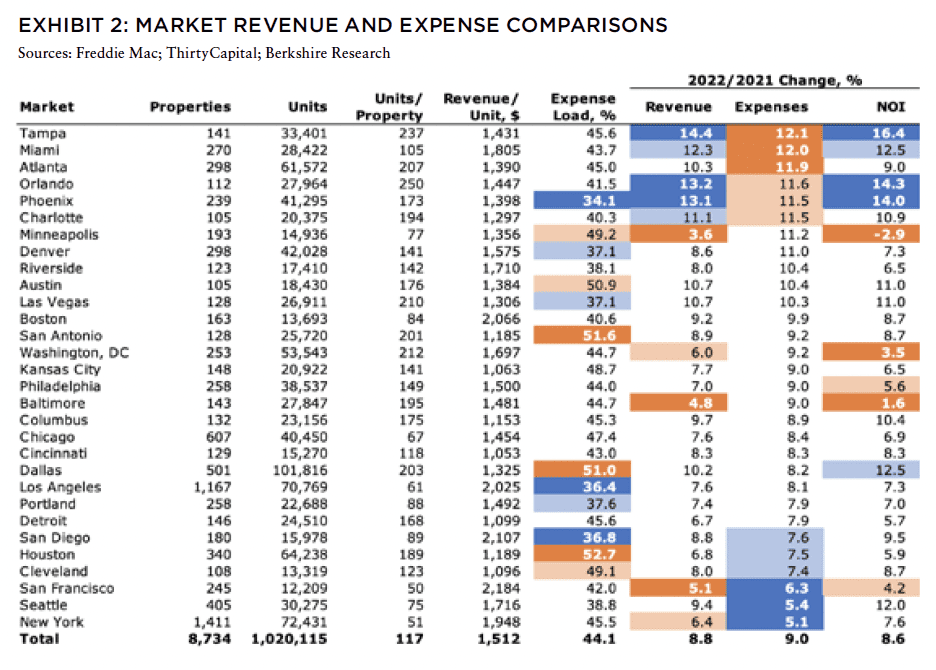
To better understand and explain how expense trends vary across the entire apartment market rather than just its higher-quality institutionally owned segment, we examined operating statements for all multifamily loans in the CMBS universe that reported full calendar year results for 2022 and 2021. The table in Exhibit 2 summarizes 2022 changes in revenue, expense, and NOI across 8,734 properties in thirty metro areas, with each having at least a hundred year-over-year property observations and together accounting for about 80% of all multifamily properties nationally that provided their operating statements last year. The prototypical apartment property in this data set had 117 units and average monthly revenue of $1,512 per unit.
Even before getting into the details of multiple expense line items, one should note that both overall expense growth and expense loads (ratios of expenses to property revenues) vary widely across markets.
There was only moderate (55%) correlation between revenue growth and expense growth across markets, and in many cases above-average revenue growth was still accompanied by below-average expense growth or vice versa. Minneapolis was the most extreme example, as the only major market where average NOI growth turned negative due to expense inflation running well ahead of revenues. This impact was further exacerbated that Minneapolis also had had above-average expense load, which made its rising pressure even more pronounced.
LINE ITEMS MATTER
Depending on how they are being accounted for, operating expenses for apartment properties are typically grouped and reported as 8-10 major line items, such including property taxes, maintenance, payroll, repairs, utilities, management fees, marketing, and other.
Taxes are by far the largest component, accounting for about 26% of the total expense for a typical multifamily property in the CMBS universe and 32% of the total for a typical institutionally owned multifamily property. Share of the total expense accounted by taxes does vary widely across markets however and that is also the case with all other line items. As a result, even the same change in a line item can have a different impact on the total, depending on a market. But changes in line items also vary widely across markets as the table below illustrates.
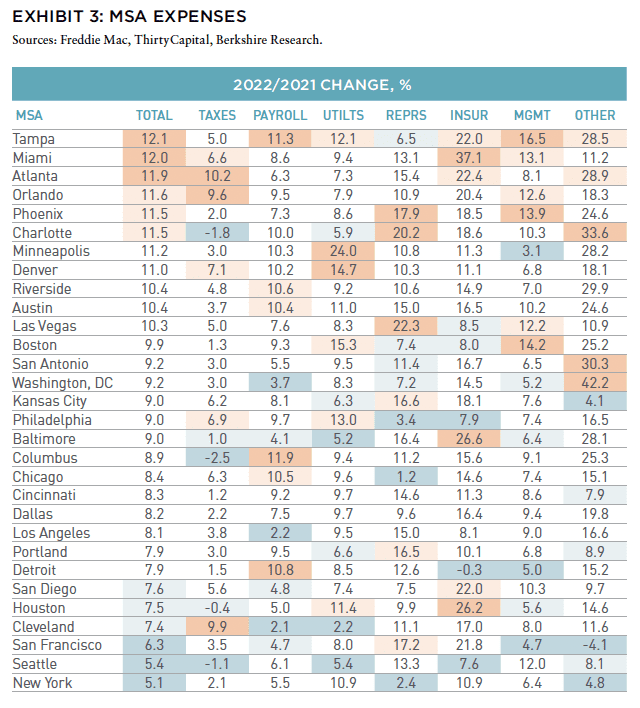
While changes in individual line items are indeed correlated with the total across markets all and each of them need to be considered to explain the variation in overall expense inflation. Changes in line items such as taxes and payroll do tend to matter more due to their share of the total, but others can be very significantly too, depending on their trends each year. In the case of Minneapolis, for example, surging utility costs were one of the key drivers behind the total expense inflation in 2022.
Of course, how each line-item changes in turn depends on both the macro trends and how those trends might be impacting various regional markets or types of assets. Utility expenses experienced high growth last year largely due to rising prices of electricity, piped gas, and oil. Nationally, the price of electricity per kilowatt hour grew by 4.4% in 2021 and 12.8% in 2022, compared to the historical (2001–2020) average of 2.2%. The price of piped gas per therm increased by 18.2% in 2021 and 26.7% in 2022, versus the historical average of 2.1%. Gasoline prices increased by 39.7% in 2021 and 33.8% in 2022, versus the historical average of 3.0%.1
Payrolls also grew more than in prior years as the tightening labor market boosted wages. Nationally, average hourly earnings in the private sector increased by 4.9% in 2021 and 6.4% in 2022, well above the historical average of 3.0%.2 Stronger economic conditions in parts of the country including the Sunbelt region, led to much higher wage growth in those areas.
Insurance-related expenses grew at record pace as incidents and costs of severe climate/weather disasters (with combined insured losses over $1 billion) continued to rise, pushing premiums higher. There were twenty such events reported in 2021 and eighteen in 2022, with combined insured losses of $159 billion and $172 billion, respectively, compared to the 2001–2020 period, which averaged eleven events and $83 billion in insured losses per year.3 Furthermore, negative returns for both stocks and bonds in 2022 also made operating environment for insurers and their re-insurers challenging from the capital reserves perspective, contributing to the hardening market.
For the higher quality institutionally owned apartments, insurance costs were still accelerating in the first half of 2023 at an annual pace of 29%, or twice the pace of the 2022 annual average over the prior five years. These increases are even more dramatic in states such as Florida, which is viewed as increasingly riskier from the property insurance perspective. The impact of rising insurance expense has become more pronounced over the last few years, and while its share of the total is still relatively small compared to other major line items, it is now more than twice of what it was in 2018.
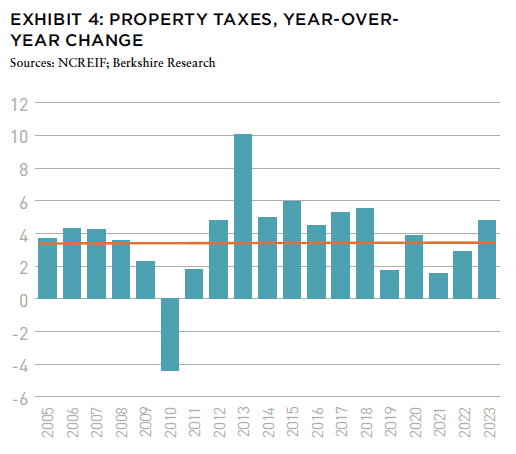
Change in taxes—by far the largest expense for apartments—is a function of changes in property values and tax rates, and both drivers are greatly impacted by the broader macro trends, such as fundamentals, capital markets environment, and fiscal health of state and local finances.
As these factors interact, they do tend to impact changes in property taxes with some lag, however (i.e., sharp drops in property values that took place in 2009 did not show up as decline in tax expenses in 2010 and the subsequent strong recovery in values that took place in 2012 did not show up as a spike in tax expenses until 2013). The most recent surge in values that took place in 2022 has started to be reflected in above-average tax expense growth in 2023.
While it does appear that rising expenses will continue to pressure on apartment NOI growth in the near term, some of them, such as payroll and utilities, are likely to start moderating—at least judging by the current trajectories in energy and labor costs. Insurance expenses should also rise much less as so far this year cumulative insurance losses being less than a third of those incurred in 2022.
And on the tax front, recent drops in apartment values should help ease that burden too (if tax rates don’t change). Of course, whether that assumption holds also ultimately depends on the ability of local governments generate sufficient revenues, especially as office real estate becomes less viable and reliable source. With a record wave of new apartment properties expected to be completed over the next two years, many of them could face above-average tax increases as has been the case in 2022 and historically.
TAKEAWAYS
There are two main practical take-aways stemming from our analysis. First, to make better decisions and have more realistic underwriting, apartment investment, owners, as well as their lenders need to pay close attention not only to variation in rent and occupancy trends across markets and property sub-types, but also expenses. In the environment when expenses are rising ahead of revenues initial proforma assumption could make a difference between a current or delinquent loan.
Second, to understand the above variation in the total expense change more fully one must consider that all major line items matter for the overall picture and both their shares of the total and changes ultimately impact the overall result. Furthermore, changes in these line items can and should be evaluated in the context of broader macro trends affecting them.
Greater availability of property-level operational data and sophisticated tools to measure, analyze, and predict it (including AI) can help address key questions not only with regards to revenue but also expense side of property operations as well as portfolio construction when it comes to market and asset selection decisions.
IN THIS ISSUE

NOTE FROM THE EDITOR: WELCOME TO #14
Benjamin van Loon | AFIRE
INSURING FOR ELSEWHERE: CLIMATE-RESPONSIVE REAL ESTATE INVESTMENT
Benjamin van Loon | AFIRE
INSURING FOR ELSEWHERE: STRIPPING THE CASHFLOW FROM THE DEAL
Paul Fiorilla | Yardi
MARKET OUTLOOK: MODEST GROWTH AND RETREATING INFLATION IN 2024
Martha Peyton, CRE, PhD | LGIM America
UNDERPERFORMANCE PARADOX: NEW RESEARCH QUESTIONS THE VALUE OF PRIVATE REAL ESTATE FUNDS
William Maher, Taylor Mammen, Ben Maslan | RCLCO Fund Advisors
NAVIGATING THE CURVE: RESILIENCE, ADAPTATION, AND PREPARING FOR 2024
Jack Robinson, PhD | Bridge Investment Group
LIQUIDITY FREEZE: POTENTIAL SOLUTIONS FOR COMMERCIAL REAL ESTATE
Christopher Muoio | Madison International Realty
SUPPLY WAVE: REASON FOR OPTIMISM IN THE MULTIFAMILY SECTOR
Sabrina Unger, Britteni Lupe | American Realty Advisors
MANAGE WHAT YOU MEASURE: UNDERSTANDING EXPENSE INFLATION IN APARTMENTS
Gleb Nechayev | Berkshire Residential + Webster Hughes, PhD | ThirtyCapital
PARSING OFFICE DISTRESS: PLANNING FOR THE NEXT GENERATION OF OFFICE SPACE
Dags Chen, Lincoln Janes, CFA | Barings Real Estat
MODEL STATES: USING ECONOMIC STATE MODELS TO ASSESS THE US OFFICE OUTLOOK
Armel Traore Dit Nignan | Principal Real Estate
OUTWARD SHIFT: WILL THE LOGISTICS SECTOR CONTINUE TO OUTPERFORM?
Kerrie Shaw | AXA IM Alts
HARNESSING THE WIND: TECHNOLOGICAL CHANGE AND THE PROMISE AND PERIL OF AI FOR REAL ESTATE
Nikodem Szumilo | University College London + Chris Urwin | Real Global Advantage
MIND YOUR DATA: REAL ESTATE INVESTING, FROM THE POINT OF VIEW OF A DATA NERD
Ron Bekkerman, PhD
OPERATING EXPENSES RISING THE OTHER MAJOR COMPONENT OF NOI GETS MORE FOCUS
Stewart Rubin, Dakota Firenze | New York Life Real Estate Investors
IN MEMORIAM: JANICE STANTON
+ LATEST ISSUE
+ ALL ARTICLES
+ PAST ISSUES
+ LEADERSHIP
+ POLICIES
+ GUIDELINES
+ MEDIA KIT (PDF)
+ CONTACT
—
ABOUT THE AUTHORS
Gleb Nechayev is Chief Economist for Berkshire Residential Investments. Webster Hughes, PhD, is Managing Director for ThirtyCapital.
—
NOTES
1. U.S. Bureau of Labor Statistics. https://www.bls.gov/. Accessed January 30, 2024.
2. U.S. Bureau of Labor Statistics. https://www.bls.gov/. Accessed January 30, 2024.
3. National Centers for Environmental Information (NCEI). https://www.ncei.noaa.gov/. Accessed January 30, 2024.
—