
WILL INCREASED STATE AND LOCAL TAX INTAKE IN MAJOR MARKETS BE UNHEALTHY FOR REAL ESTATE PORTFOLIOS?
The Tax Cuts and Jobs Act of 20171 provided a significant tax overhaul for individuals and businesses. In the current decade, and prior to this 2017 legislation, the US experienced a pronounced decline in interstate migration. Changes to state and local tax (SALT) deductions could serve to increase migration for higher-tax to lower-tax states, though early indicators are mixed as to whether the legislation will have a material impact on migration trends.
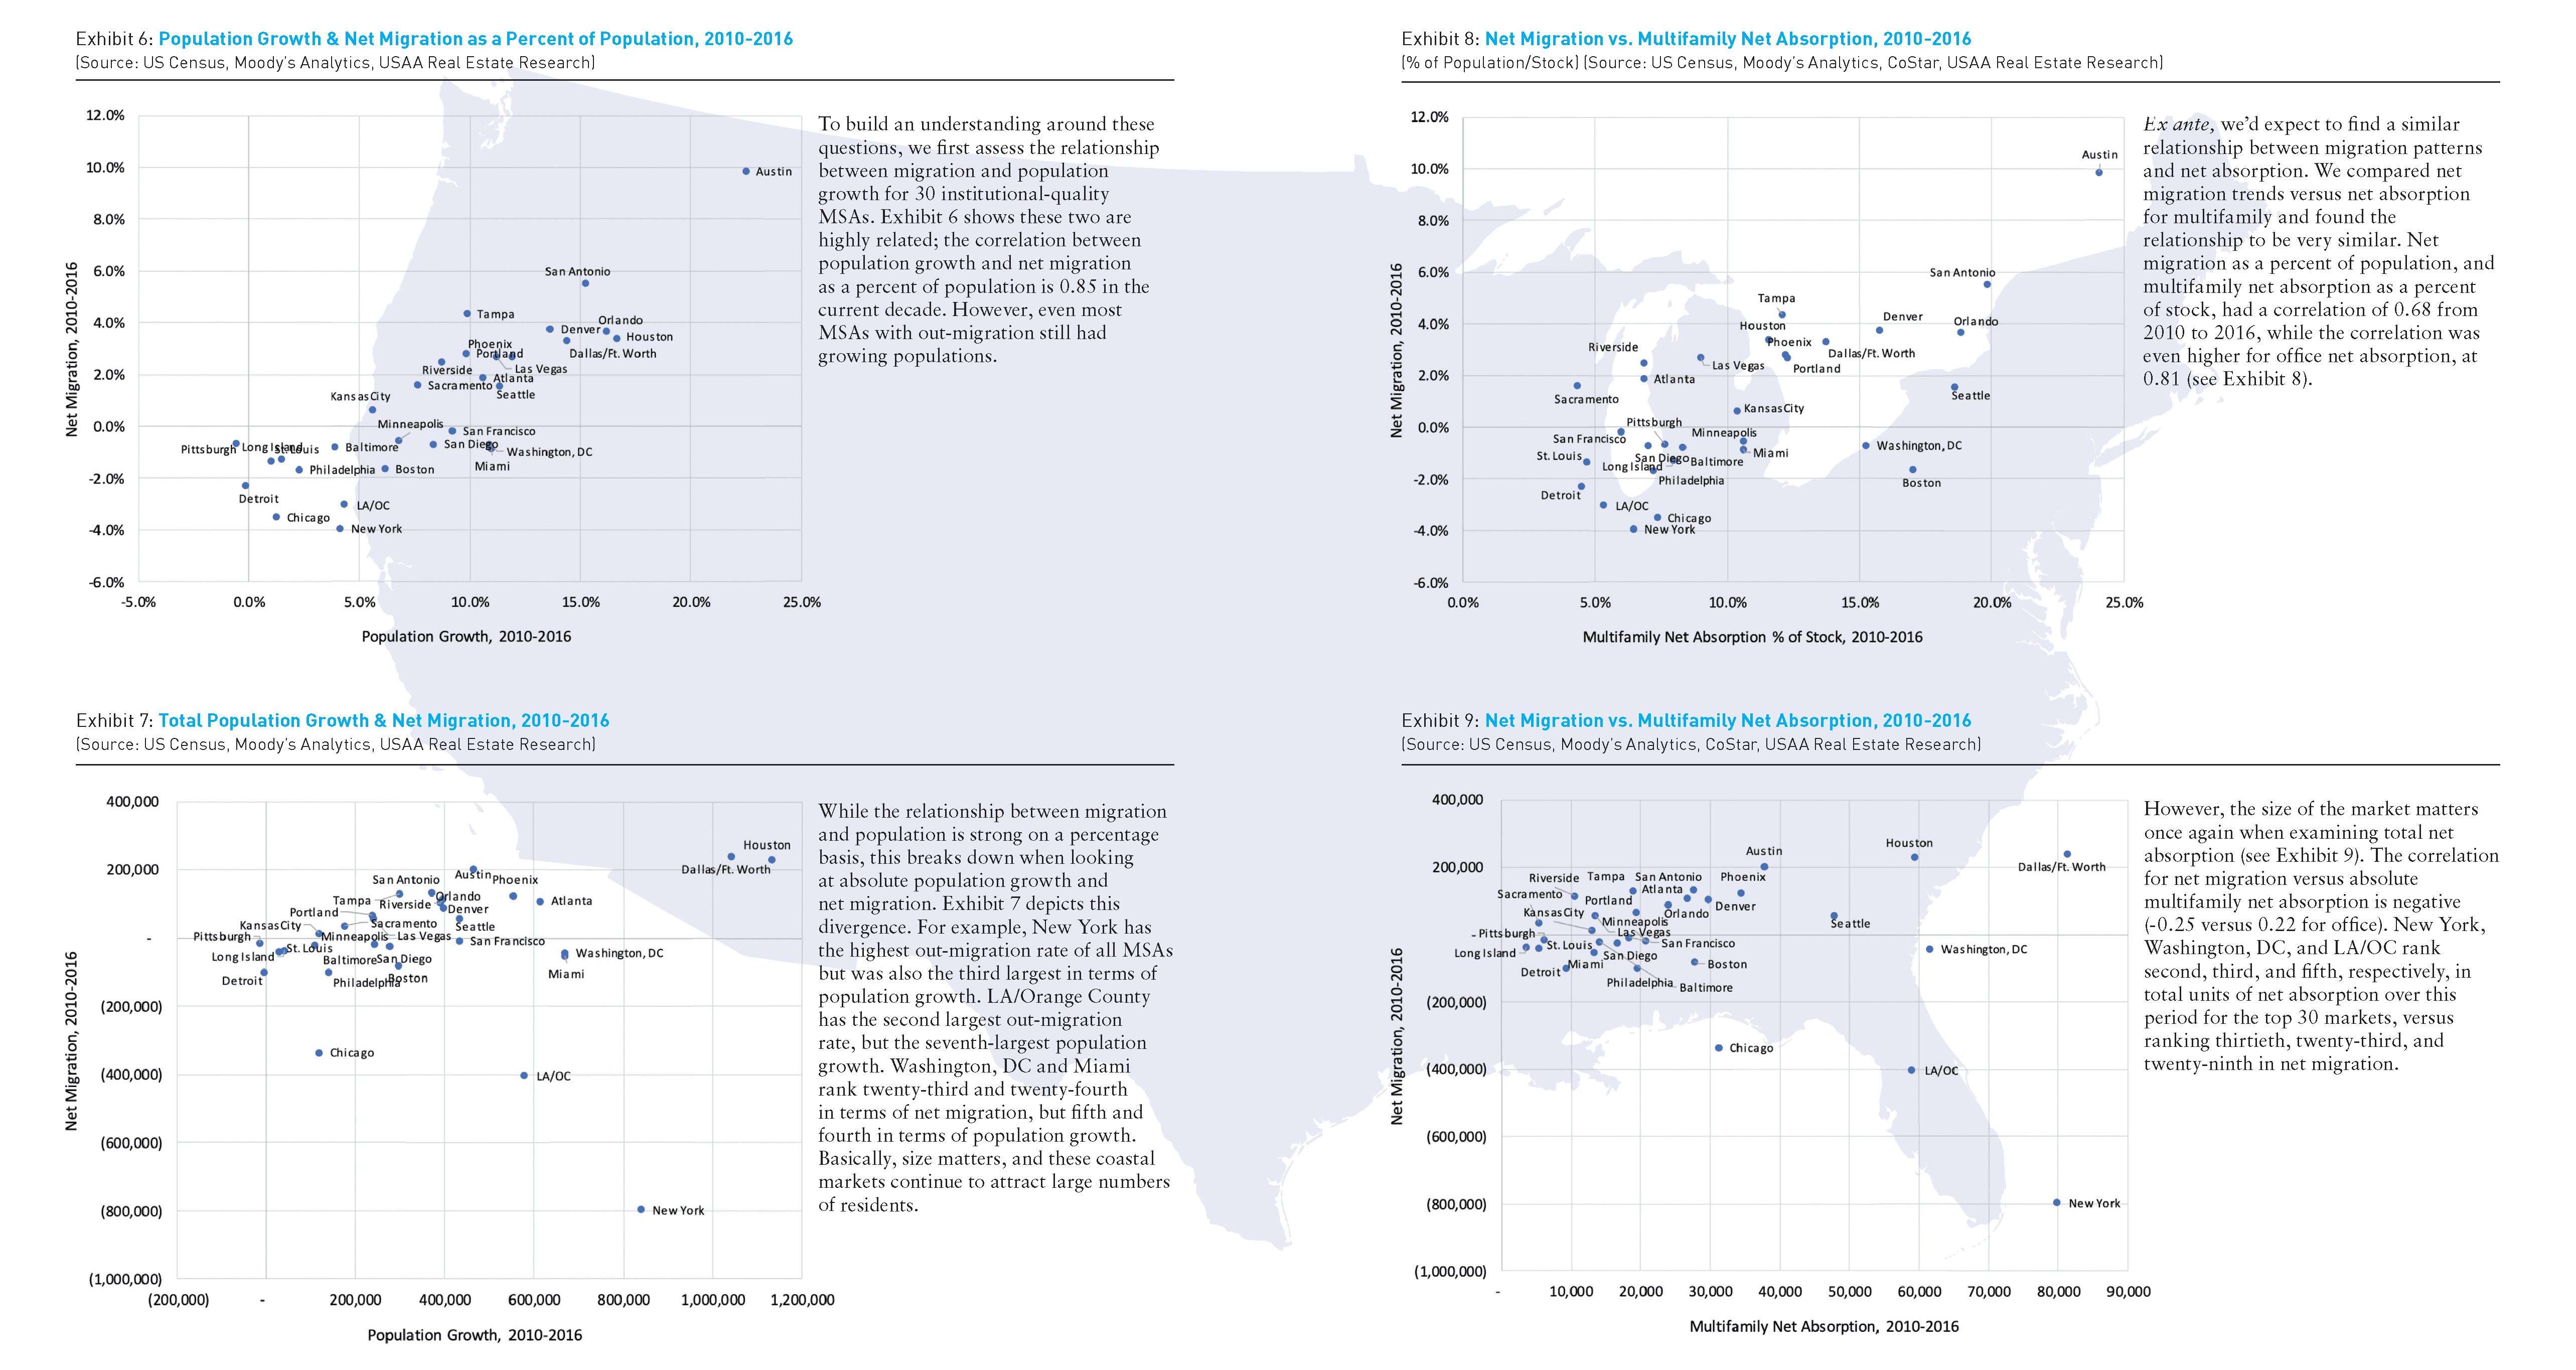
Metropolitan statistical area (MSA) trends have a strong relationship to population growth and multifamily net absorption as a percent of stock, though are less tied to absolute growth. The impact of migration trends on multifamily total returns is less robust, though the effect of the tax legislation will be improved real estate performance in lower-tax MSAs, relative to higher-tax MSAs. Early indications suggest that these effects will be at the margins, while the largest coastal and established real estate markets should remain attractive for institutional investors moving forward.
Ultimately, we need to ask if a meaningful shift in migration trends, and their impacts on real estate markets, could result from the recent changes to the tax law.
Let’s take a closer look.
TAX LEGISLATION & IMPACT ON REAL ESTATE PERFORMANCE
Migration within the US in search of economic opportunity is part of the nation’s ethos. The early pioneers who traversed the California Trail to achieve wealth during the California Gold Rush in the mid-1800s are a prominent example of this.
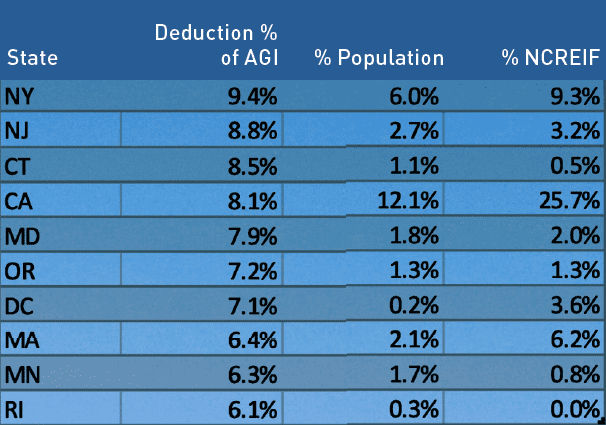
(Source: The Tax Foundation, Moody’s Analytics, NCREIF, USAA Real Estate Research)
Recently, the issue of similar migration trends has come into focus following the passage of the Tax Cuts and Jobs Act in December of 2017, one element of which was to place a federal cap on deductions for SALT and property taxes. Households with income over $100,000 comprise 91% of those taking a SALT deduction, and the total number of households taking SALT deductions is projected to have declined from 42 million in 2017 to 17 million in 2018. As shown in Exhibit 1, the top four states impacted negatively by the SALT cap comprise 22% of the total US population and 39% of the commercial real estate portfolio2 for institutional investors. California, New York, and Massachusetts have commercial real estate allocations significantly above their population weightings.
There is evidence that state taxes influence where both corporations and people choose to reside, in particular for top earners.4 Accordingly, institutional investors are concerned that if the recent tax law changes increase the pace of high-income residents relocating from states most adversely affected (and these same high earners are disproportionately making decisions about where their companies job growth will occur), this could negatively impact the relative performance of their real estate portfolio.
US MIGRATION TRENDS OVER THE PAST 40 YEARS
To assess migration patterns going back to 1980, we utilize US Census Bureau data, including migration data from tax filings, based on the primary mailing address as of the first year filed compared to the second year filed. The primary data fields we analyzed include:
- Tax filings (a proxy for households)
- Dependents (a proxy for population as it included filer, spouse of filer, and all dependents)
- Adjusted Gross Income (AGI) (includes all taxable income, less adjustments)
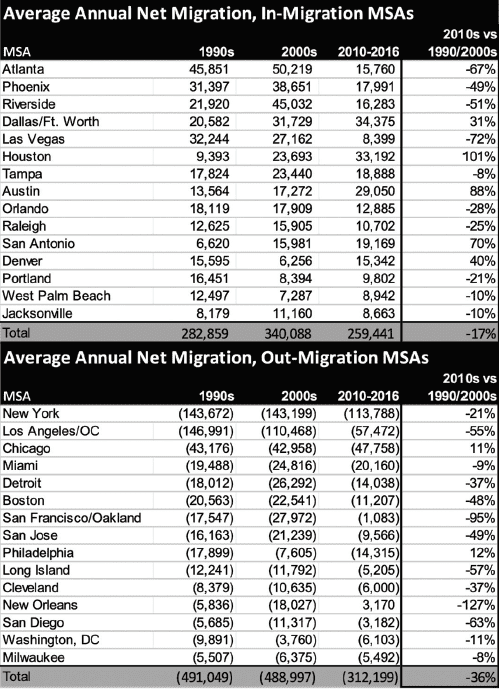
(Source: US Census, USAA Real Estate Research)
This information is published at the state and county level. Exhibit 2 shows these trends by MSA. A few highlights: (1) Out-migration for the top 15 MSAs is down 36%, compared to down 22% for the top 10 states. This may be reflective of increased urban living. For example, Colorado in-migration is flat this decade, but Denver in-migration is up 40%. (2) The major four Texas MSAs have all seen outsized performance. (3) The San Francisco/Oakland MSA has closed the migration spigot this decade.
(Source: US Census, USAA Real Estate Research)
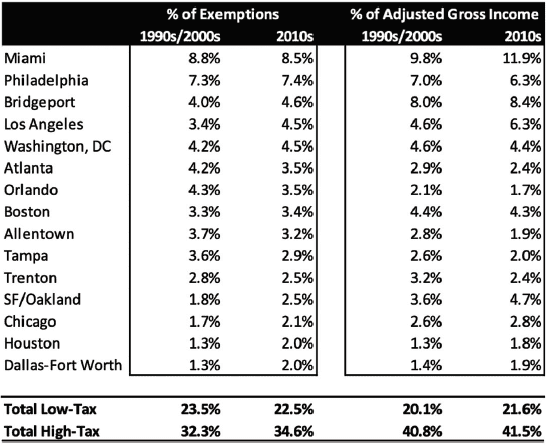
Exhibit 2 largely addresses migration patterns in terms of headcount. To address high-income earners specifically, we break down the information for the largest net out-migration market, New York, by movers to high- or low-tax areas, both by total population and total adjusted gross income. For New York, the top 15 MSAs where people moved captured 57% of total move-outs. While a low-tax destination, Miami, ranked first, New Yorkers generally moved more often to high-tax destinations than low-tax destinations, both from a population and income perspective (see Exhibit 3). In the current decade, high-income New Yorkers were more likely to choose a high-tax market as well.
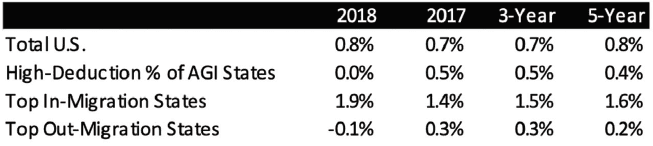
Another way to derive potential migration trends would be population growth, where the Census has released data for 2018.5 Here we do see potential indications of a trend: Overall US population growth in 2018 was relatively flat compared to 2017, as well as over the three-year and five-year period leading up to 2018 (see Exhibit 5). However, for the states with elevated deductions as a percent of AGI, growth evaporated in 2018.
IMPACT OF THE TAX CUTS AND JOBS ACT
One challenge with the IRS/Census Bureau data is the lag in the information. The Tax Cuts and Jobs Act was passed in December 2017, effective for 2018. Many citizens were not required to file their 2018 taxes until April 15, 2019, and the Census Bureau won’t release the data until September 2020. Thus, we are unable to assess the early impact of the tax law changes using IRS/Census Bureau data at the state or MSA level. However, we do have overall state-to-state movers from 2018, and surprisingly, total mobility was down just under 10% for 2018 compared to 2017, and 1% below the average for the 2010s (see Exhibit 4).

(Source: US Census, USAA Real Estate Research)
(Source: US Census, USAA Real Estate Research)
Anecdotally, a counterargument to the idea that tax legislation will have a significant impact on migration trends are recent announcements by large tech companies regarding expansion and corporate relocation. These firms appear to remain highly focused on talent. Recent high-profile examples include:
- Google’s December 2018 announcement that it will spend $1 billion to build a new campus in New York City, and April 2019 announcement it had leased four buildings in north San Jose.
- Amazon’s November 2018 announcement of its selection of Crystal City and Long Island City for its HQ2 expansion.6
- Apple’s December 2018 announcement of a new, $1 billion campus in Austin, as well as new sites in Seattle, San Diego, and Culver City.
MIGRATION PATTERNS & REAL ESTATE PERFORMANCE
Ultimately, real estate investors are interested in how changes in migration patterns will create opportunities and risks in their portfolio. Assessing the historical impact of migration patterns on overall demographic changes and real estate performance can help with this. Are coastal states, such as New York and California, facing a significant risk because of the Tax Cuts and Jobs Act?
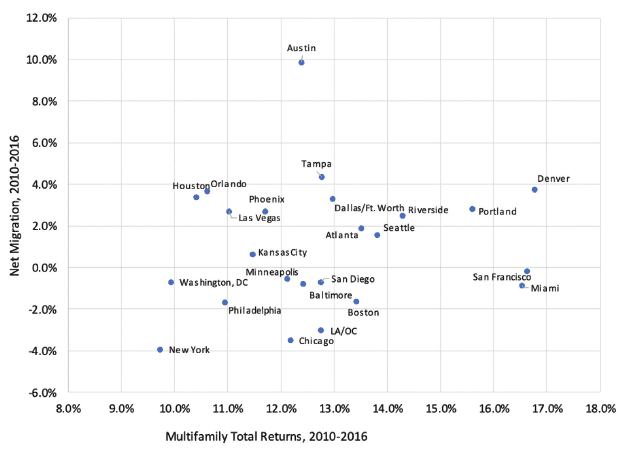
We tested the relationship between net migration and multifamily total returns as well. Correlation falls below a meaningful threshold, at 0.11 (see Exhibit 10).
(Source: US Census, Moody’s Analytics, NCREIF, USAA Real Estate Research)
The Tax Cuts and Jobs Act of 2017 should serve to make lower-tax states and MSAs even more attractive to US citizens, particularly high-earners.
Overall interstate and inter-MSA migration activity slowed over the past decade. This has generally been a strong positive for states such as NY and CA, which have experienced strong net outflows in previous decades. Early indicators show mixed results as to whether the recent legislation has reversed this decline.
To the extent the legislation impacts migration trends, it will offer opportunities in lower-tax states – particularly for development projects to meet increased demand. There is a meaningful relationship between net absorption as a percent of stock in the multifamily and office sectors, and net migration. However, some MSAs with net out-migration still rank near the top in absolute net absorption. For stabilized properties, there is no demonstrable evidence that the modest changes to net migration will impact rent growth or total returns. Thus, coastal markets with large institutional investment should not be severely impacted in a negative manner by this legislation.
—
ABOUT THE AUTHOR
Mark Fitzgerald, CFA, is CAIA Senior Director, Research; Chenchao Zang is a Data Science Associate, Research; and Will McIntosh, Ph.D, CRE, is Global Head of Research for USAA Real Estate Company, which invests capital for the benefit of its partners and acquires, develops, finances and manages a diverse portfolio of global assets.
NOTES
1. Official name: “To provide for reconciliation pursuant to titles II and V of the concurrent resolution on the budget for fiscal year 2018.”
2. Per NCREIF.
3. Population and real estate concentration data as of Q1 2019, deduction information as of 2016.
4. Moretti, E..; Wilson, D.J.; “The Effect of State Taxes on the Geographical Location of Top Earners: Evidence from Star Scientists,” American Economic Review, Vol. 107, No. 7. (July 2017), pp. 1858-1903.
5. Note that state-to-state migration and population are not the same. There is foreign migration, births/deaths, and also a significant amount of movement that is not captured by the IRS census data.
6. While Amazon subsequently pulled back on its Long Island City expansion as a result of political fallout regarding tax incentives, several reports indicate it they are actively seeking space in Manhattan as of mid-2019.
THIS ARTICLE ORIGINALLY APPEARED IN SUMMIT: ISSUE #2
—