
This article appears in Summit Journal (Summer 2020) | Download PDF
THE ECONOMIC IMPACT OF COVID-19 WILL NOT BE FELT EQUALLY ACROSS THE US.
WHICH METROS ARE WELL-POSITIONED FOR LIFE AFTER CORONAVIRUS (AND WHY)?
With social and leisure events canceled, many stores and offices closed, and malls and airports well below capacity, the coronavirus pandemic may seem like a unique economic challenge that will fundamentally change how metro-level economies function. However, our analysis suggests cities with high exposure to non-cyclical industries based in science, technology, engineering, and mathematics (STEM), and strong demographic trends, will see a much less severe economic impact from the coronavirus pandemic than cities with high exposure to cyclical, overvalued, or undercapitalized industries, and weak macro drivers.
Historically, metro-level performance has not been solely determined by the metro’s exposure to the root cause of an economic crisis, but rather whether or not the metro has a diverse economy and a well-positioned workforce when entering into a crisis. For example, the economic impact of the dot-com bubble was not limited to Silicon Valley. It also impacted Northern Virginia, given that its telecom sector was poorly capitalized. Similarly, while the global financial crisis did negatively impact New York City, the US financial capital, and Las Vegas, the epicenter of the housing boom, it had a more permanent negative impact on rust belt cities such as Detroit, Buffalo, and Cleveland, which had not adjusted to the new service-based US economy.
Recent history suggests a financial, economic, or pandemic crisis strikes the US economy nearly every decade. Real estate investors can learn from this history by positioning their portfolios for resilience, particularly at the market level. Going forward, it will be more important than ever for real estate investors to allocate towards well-positioned metros, given that location is a key component of determining real estate value.
In this article, we explore the factors that can be used to evaluate the 50 largest US metropolitan statistical areas (MSAs) and rank their projected performance through the end of 2020.
KEY FINDINGS
Markets with large exposures to more stable industries, such as information technology (San Jose, California), life science (Boston), and defense (Washington, DC) are positioned to recover the fastest. Meanwhile, markets with large exposures to cyclical industries such as tourism (New Orleans), hospitality (Las Vegas), energy (Oklahoma City), and retail (Miami) are positioned to perform the worst.
The five most highly ranked MSAs in this analysis are Boston, Washington, DC, Nashville, Columbus, and San Jose.
In contrast, the five lowest ranking are Chicago, New York, Buffalo, Miami, and New Orleans.
WORST-POSITIONED METROS IN TERMS OF EMPLOYMENT
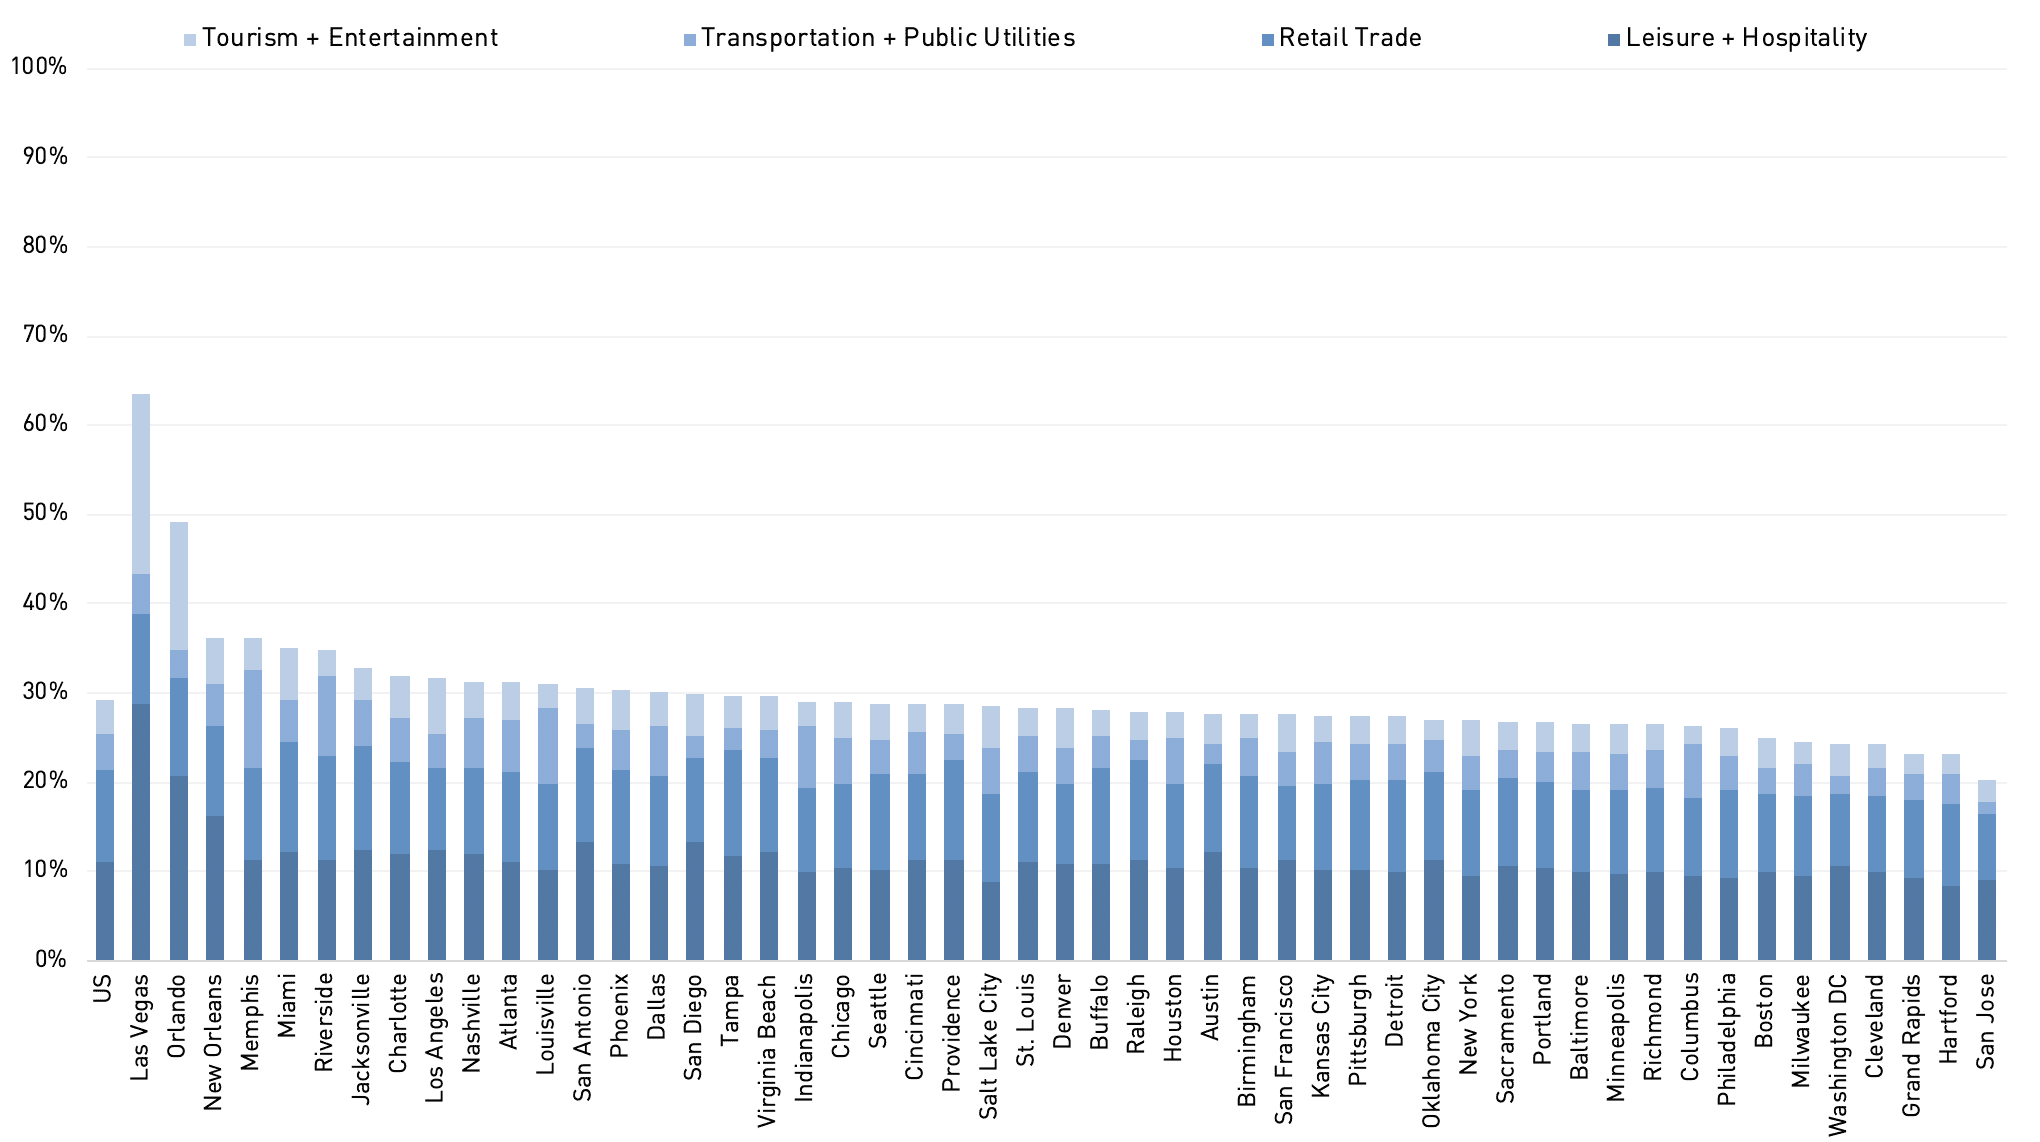
Similar to how the global financial crisis disproportionately impacted markets with the greatest exposure to housing-related industries, the coronavirus pandemic will disproportionately affect cities with the greatest exposure to the leisure and hospitality, retail, transportation, and public utilities, and tourism, and entertainment. Such areas include Las Vegas, Orlando, New Orleans, and Miami.¹ High unemployment in these cities will negatively impact real estate values across sectors, including housing, office, and alternatives, as overall consumption and investment will be curbed. Cities that have high exposure to some but not all of these sectors, such as Houston, San Antonio, and San Diego may also be disproportionately impacted, but are better positioned due to more diversified employment bases.
Exhibit 1: Concentration of employment in tourism and entertainment, transportation and public utilities, retail trade, and leisure and hospitality to total employment
(Top 50 metros as of December 2019)
BEST-POSITIONED METROS IN TERMS OF EMPLOYMENT
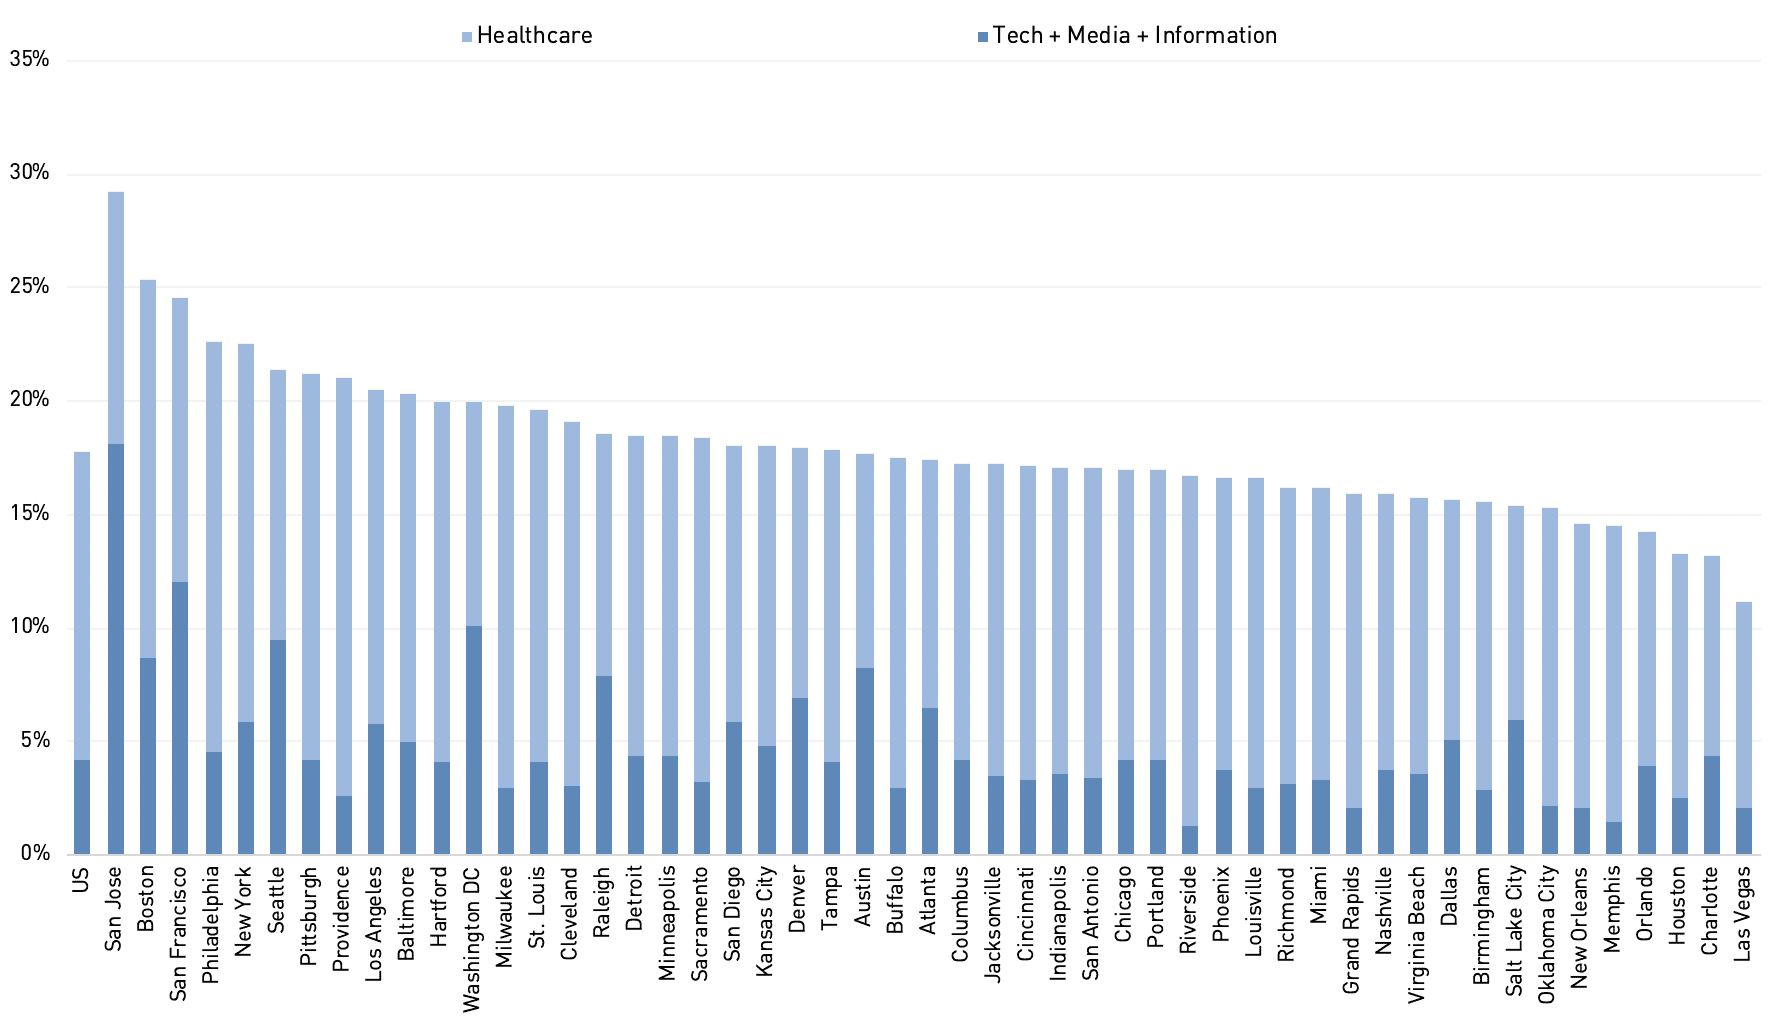
The technology and healthcare sectors are best positioned to weather the economic impact of the coronavirus pandemic. Cities with high exposure to these sectors appear positioned to outperform. The technology sector should benefit from both higher demand for digital products and online services, as well as a strong remote work infrastructure. The healthcare sector will benefit from higher demand for services and higher public investment in the sector. Cities with a greater amount of healthcare workers per capita will also be better positioned to combat the ongoing pandemic.
Cities with high exposures to these areas include San Jose, Boston, San Francisco, Philadelphia, and Seattle.² However, it is important to note that this outperformance may not extend to severely impacted sectors such as lodging and retail, which will be negatively impacted by social distancing policies, regardless of geography.
Exhibit 2: Concentration of employment in tech, media, information, and healthcare to total employment
(Top 50 metros as of December 2019)
FOSSIL FUEL EMPLOYMENT
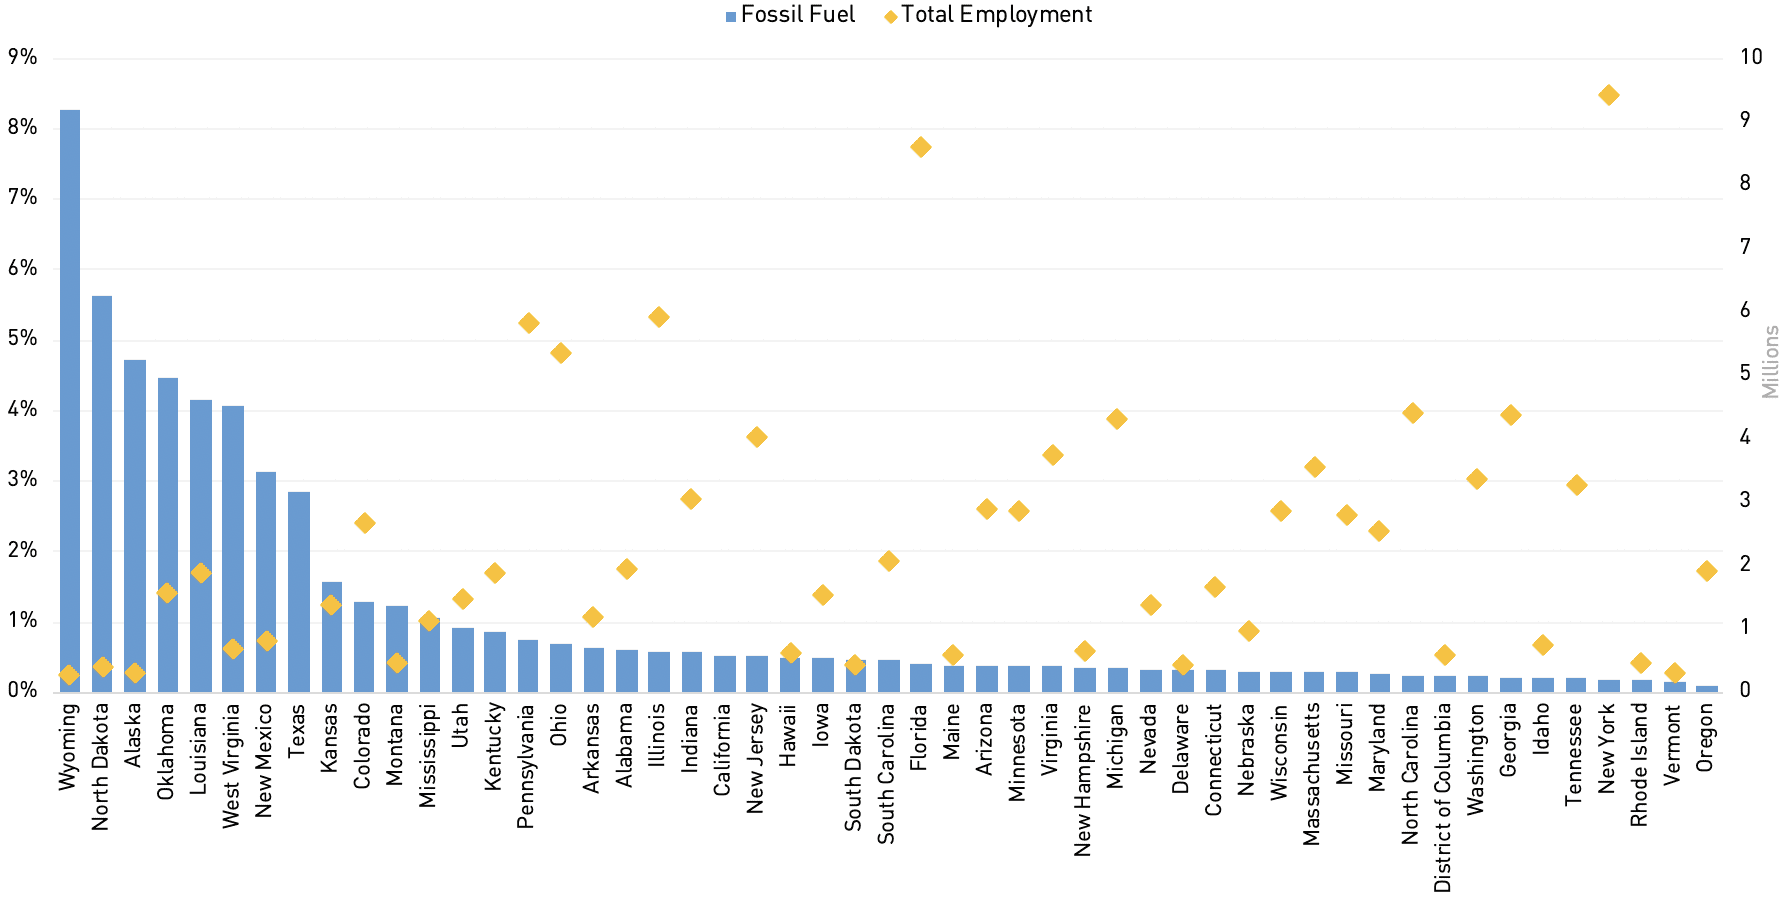
The volatility of crude oil and other fossil fuel commodities could cause long-term harm to the fossil fuel industry. Companies that produce or generate energy tied to fossil fuels are generally not well capitalized and operate in a highly competitive cyclical industry. Additionally, these companies face long-term headwinds, such as competition from renewable sources, more prevalent energy-efficient technologies (e.g., electric cars), lower investment from institutional and sovereign wealth funds, and political opposition driven by climate change concerns. For this reason, metros with high exposure to fossil fuel employment (e.g., Houston) could be negatively impacted, especially metros with high exposures that lack employment diversification (e.g., New Orleans, Oklahoma City).³
Exhibit 3: Concentration of employment in fossil fuel to total employment
(Top 50 metros as of December 2019)
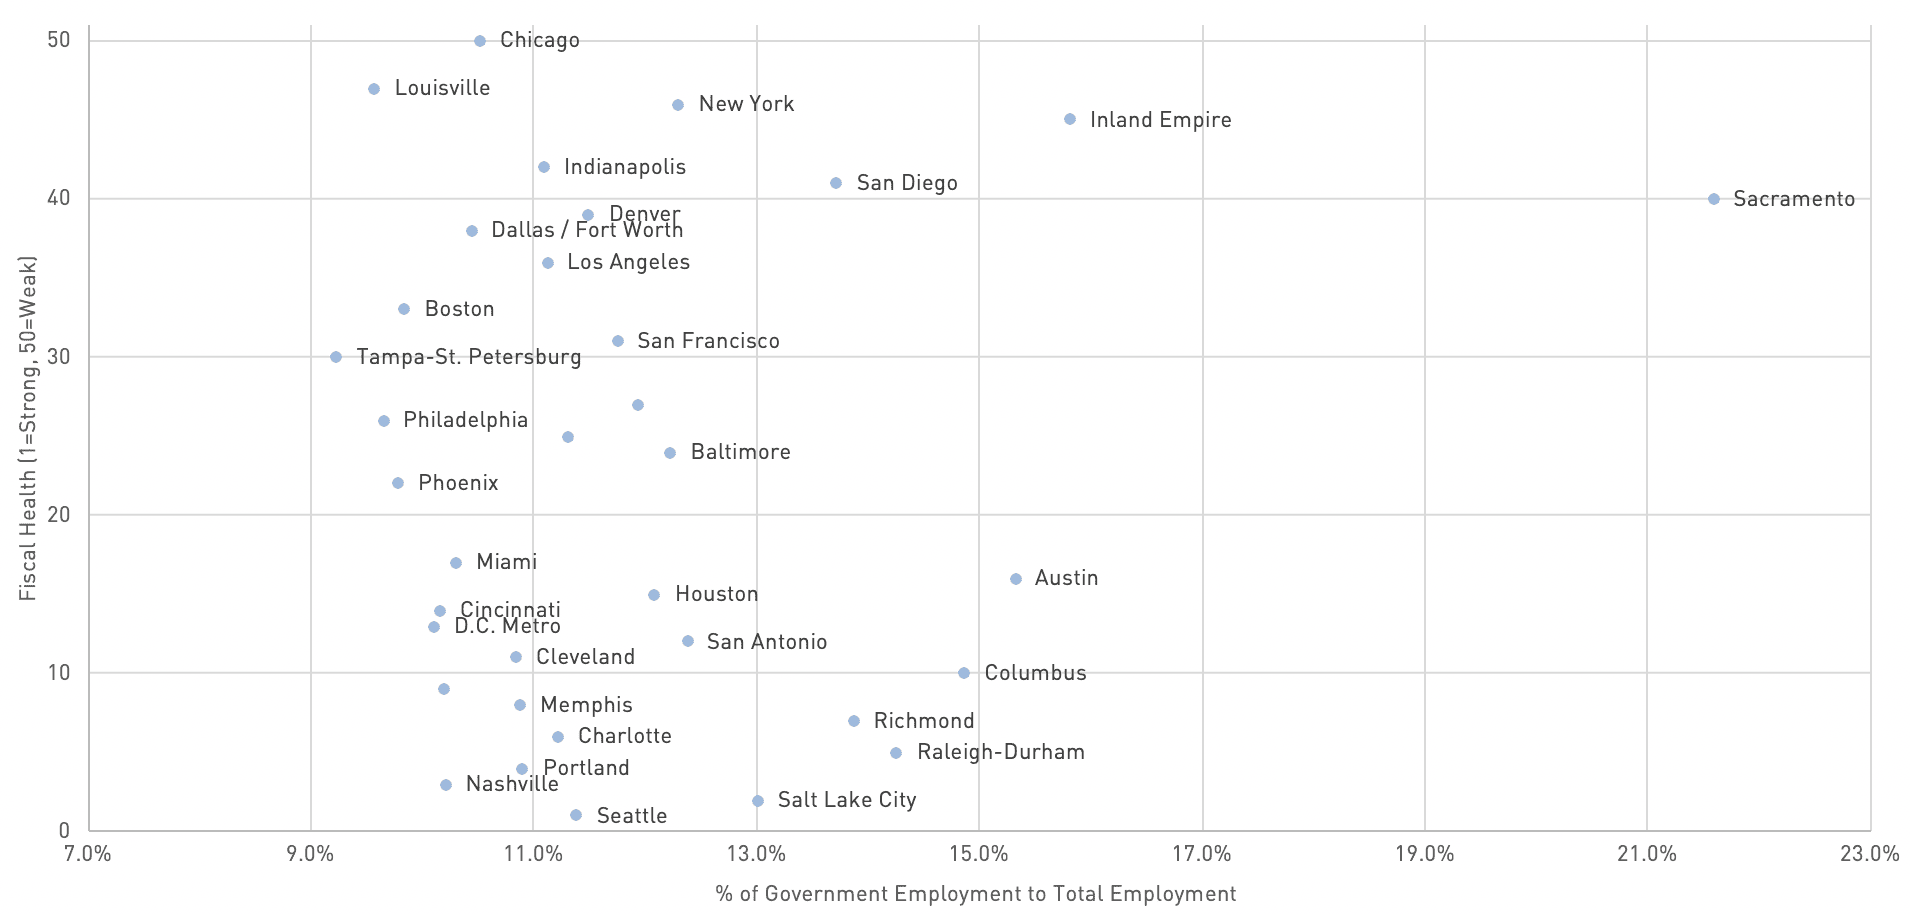
FISCAL HEALTH AND GOVERNMENT EMPLOYMENT
The coronavirus pandemic will put a strain on state and local governments—particularly their fiscal budgets. Given that state and local governments need to maintain balanced budgets, they will almost certainly lay off government employees to cut expenses and maintain fiscal solvency.
State and local austerity measures can hurt the local economy, especially in areas where government employees make up a large portion of the workforce. Additionally, states and municipalities that rely on income and sales taxes from cyclical industries will be more likely to incur large deficits during this pandemic.
Cities with weak fiscal health and higher dependence on government employment (shown below in yellow) such as Sacramento, San Diego, Southern California’s Inland Empire, New York, and Chicago, will likely see the most consequential fiscal impacts from the coronavirus pandemic.⁴
Exhibit 4: Fiscal health and government employment
(Top 50 metros as of December 2019)
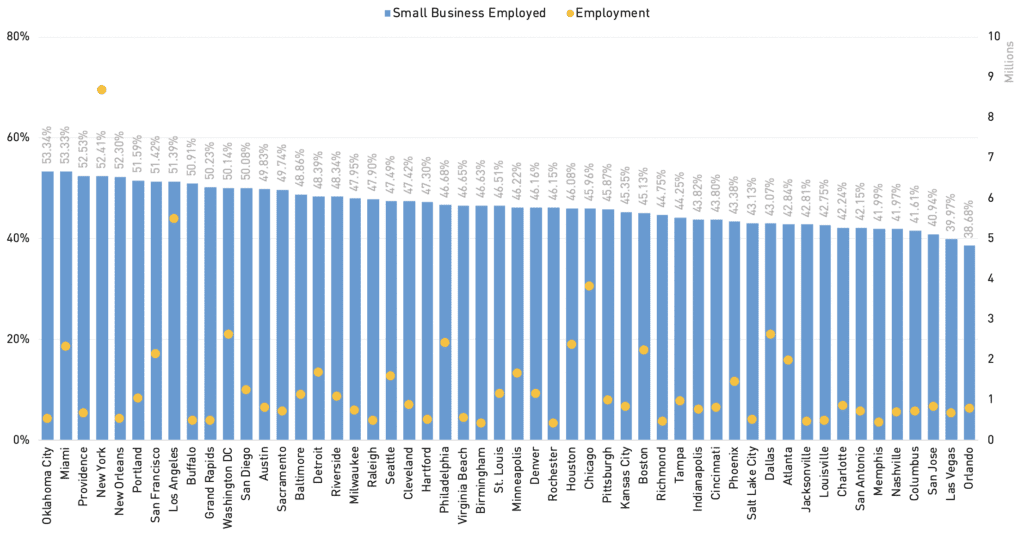
SMALL BUSINESS EMPLOYMENT
Small businesses are at risk during the pandemic given that many of them operate in the lodging, retail, and entertainment sectors, and most are not well-capitalized. In some jurisdictions, the economic shutdowns have occurred for three months or longer, which has put many small businesses at risk of closure if not given financial assistance.
Both the federal government and Federal Reserve have implemented small business lending programs to try and combat this issue. The recently passed $2 trillion CARES Act provides US$376 billion in funding for small businesses, though there is no guarantee that lending will be given to all businesses in need. These programs could put major strains on the banking sector and could be undone by bureaucracy.
Cities such as Oklahoma City, Miami, New York, and New Orleans have a high proportion of small business employment and will underperform if these programs do not succeed.⁵
Exhibit 5: Concentration of workers employed through small businesses by metro
(Top 50 metros as of December 2019)
CORONAVIRUS SEVERITY BY METRO
The severity of the coronavirus pandemic in each metro will be a key determining factor in metro performance. During the first wave of the pandemic, cities with higher densities (e.g. New York, Chicago) or relatively high poverty rates (e.g. Detroit, New Orleans) have been most severely impacted by the pandemic, as measured by mortality rate.
A key risk factor that may determine the ultimate severity of coronavirus impact in a given metro is the proportion of residents that are 65 or older. Miami, Pittsburgh, Tampa, and Cleveland are all major metros with a significant share of seniors, at around 20%. In contrast, cities such as Austin and Salt Lake City, which have a low proportion of this at-risk demographic, may be in a better position to avoid a severe coronavirus impact.
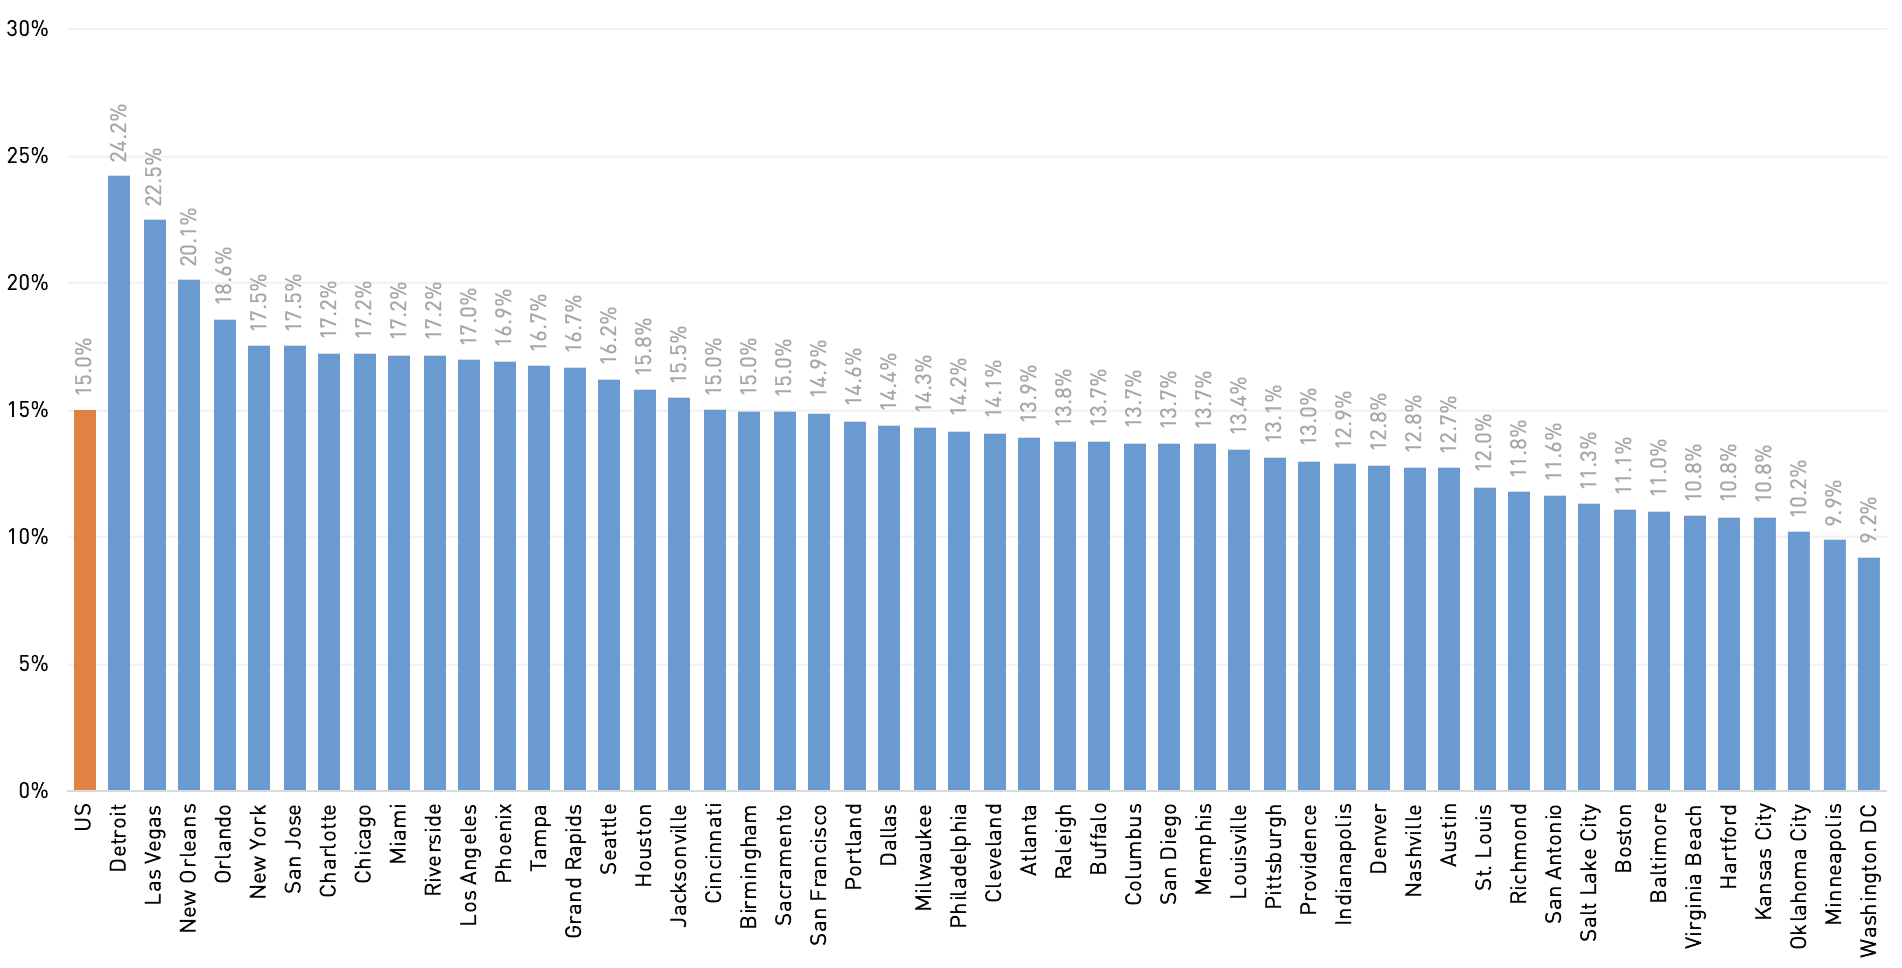
UNEMPLOYMENT AND GROSS METRO PRODUCT
Baseline unemployment rate and GMP growth projections provide references for forecasting metro-level economic performance. Projections are subject to the assumptions of the forecaster,⁶ but metros with high exposure to cyclical and underperforming industries tend to have higher projected 2Q 2020 unemployment rates and lower 4Q 2020 GMP growth.
Exhibit 6: Q2 2020 projected unemployment rate by metro
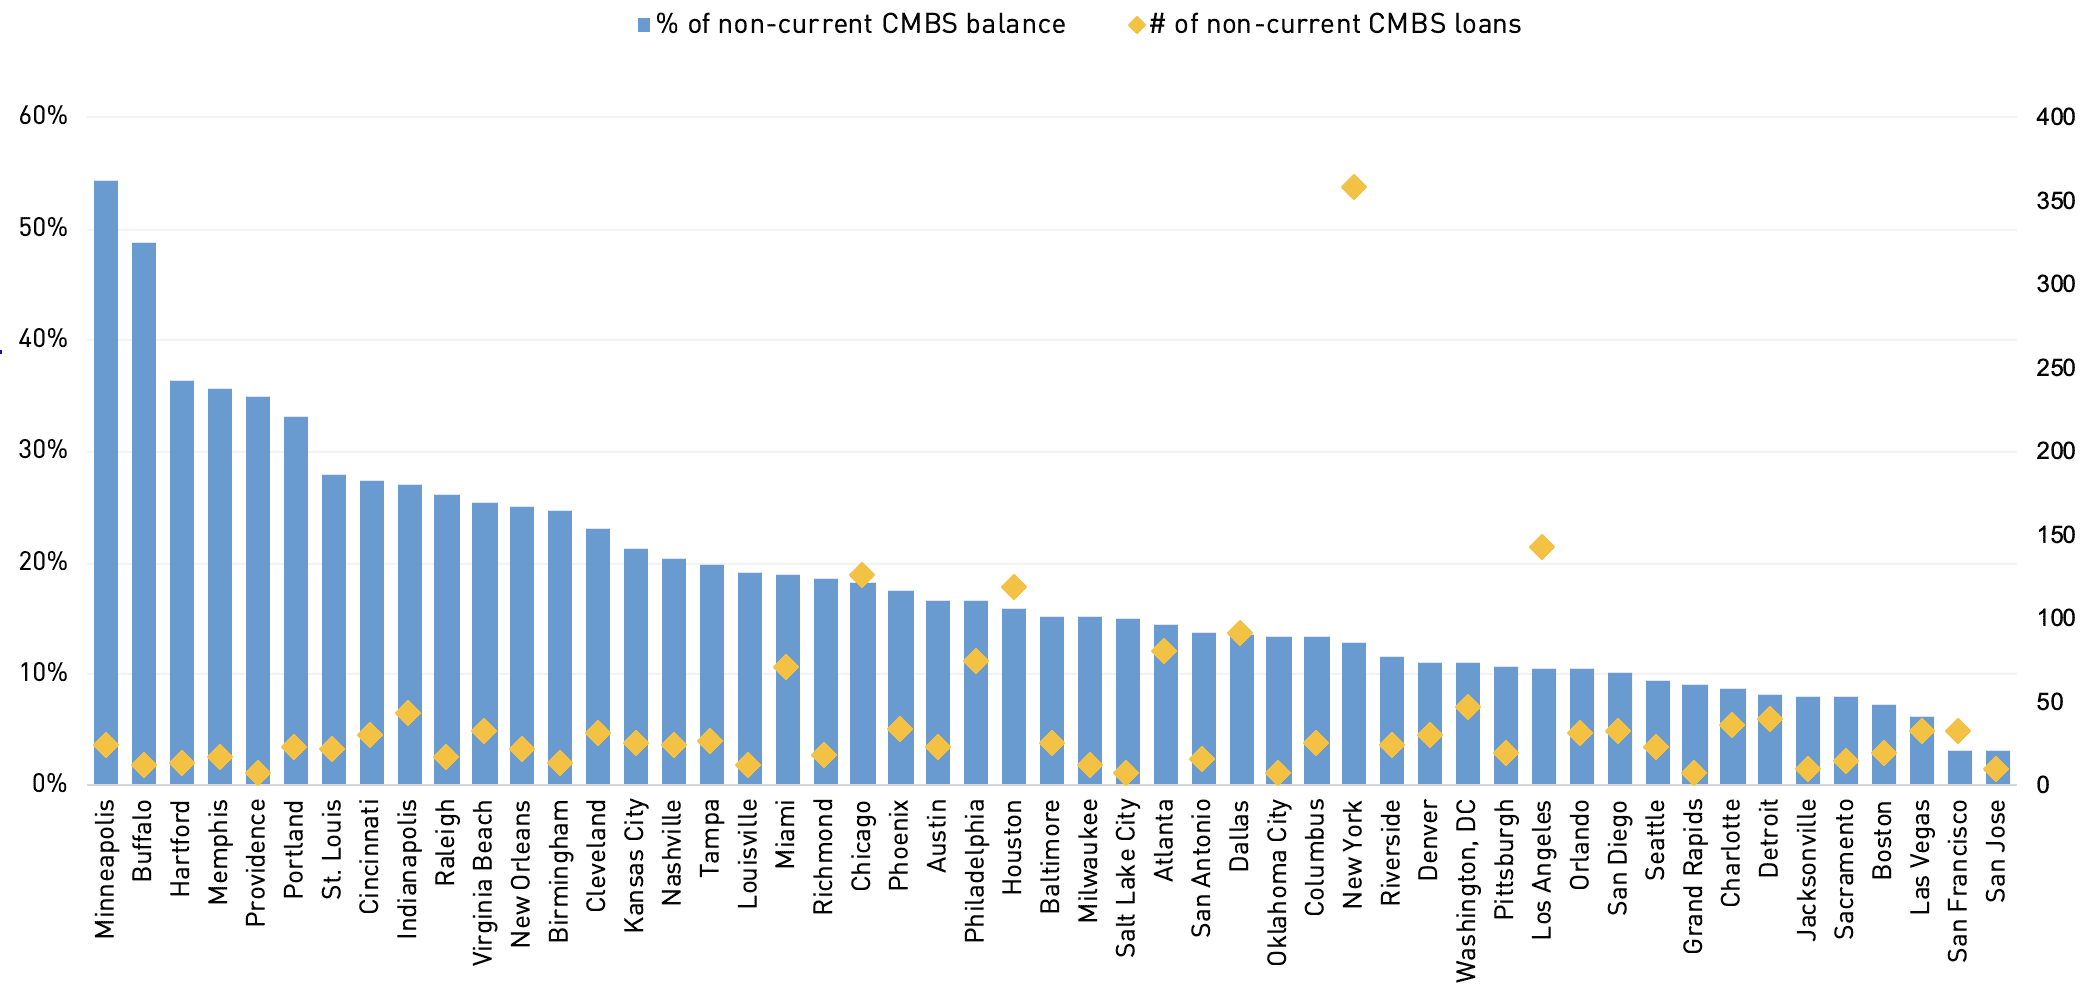
PROPORTION OF NON-CURRENT COMMERCIAL LOANS
Over the past few months, a significant proportion of commercial mortgage sponsors, particularly those managing retail and lodging properties, have requested forbearance on loan payments. One can use non-agency CMBS loans as a proxy to graph the proportion of non-current commercial loans. Specifically, this refers to loans that are classified as grace period/late, delinquent, in special servicing, REO, or foreclosed. Some metros have CMBS exposure to large retail loans (e.g., Mall of America in Minneapolis, Walden Galleria in Buffalo) which are non-current due to forbearance requests but are expected to perform. With that said, metros that have a higher proportion of non-current loans tend to have higher exposures to the retail and lodging sectors.
The speed of the economic recovery will be a key factor in determining whether non-current loans will be paid off in full. If the economic recovery is quick (exhibits a V-Shape), sponsors will be able to make differed interest-payments. If the economic recovery is slow (exhibits an L-Shape), sponsors are at risk of default or foreclosure.
Exhibit 7: Percentage of non-current CMBS loans
MEASURING THE ECONOMIC RECOVERY
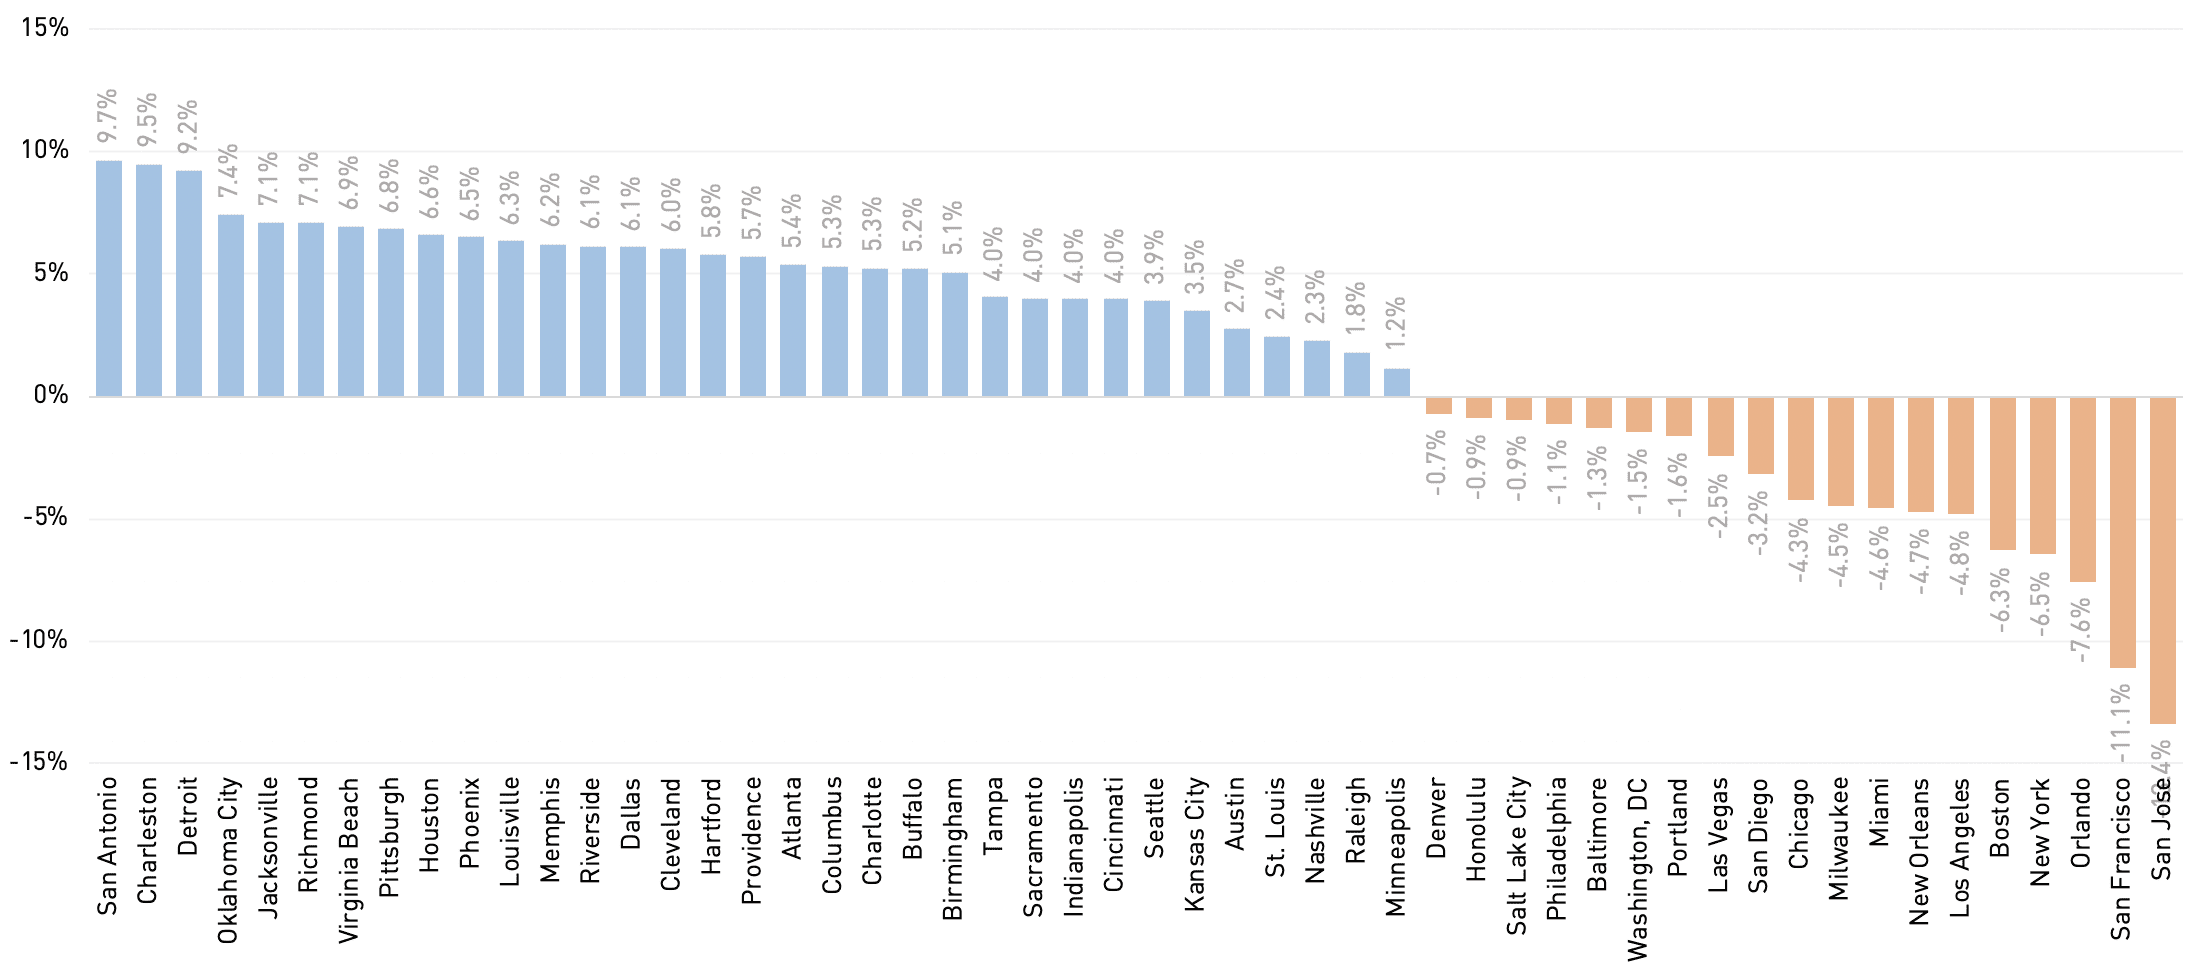
The speed of economic recovery will vary by metro depending on (1) how quickly stay-at-home orders were lifted in the area, and (2) the metro’s exposure to high-performing industries that can recover quickly from the pandemic. Many small and large businesses are highly levered and will require a speedy economic recovery to remain afloat. We use consumer spending as a leading indicator to measure economic activity, given that it drives economic heath more directly than investment, government spending or trade.
Some states, such as New York and California, have followed a gradual reopening process, which is one of the key reasons why metros in those states are showing large decreases in spending levels year-over-year. Metros that do not rely heavily on tourism, such as Pittsburgh or San Antonio, have seen strong population growth over the last year and will be in a better position for a quick economic recovery.
Exhibit 8: Change in consumer spending, year-over-year (%) (as of May 2020)
The factors highlighted here do not represent all the factors that can be examined for evaluating the economic impact of the coronavirus pandemic. Other factors can be considered, such as the pandemic’s effect on immigration, gig workers, or other major sectors such as construction and manufacturing. Additionally, the impact of coronavirus pandemic could vary significantly based on (1) the severity and infectiousness of later virus waves, (2) how rapidly various sectors of the economy can recover from the shutdown, and (3) the possibility that the pandemic leads to trade issues or political unrest.
Finally, the impact on specific property types in a given metro can vary significantly from the metro economy as a whole, as sector performance is also driven by supply, demand, and valuation. However, this framework provides real estate investors with a way to assess the metro-level economic impact as well as the real estate impact of the coronavirus pandemic.
—
ABOUT THE AUTHORS
Jayanth Ganesan is a Research Analyst, Americas; David Segall is a Director, Americas; and Melissa Reagen is Head of Research, Americas for Nuveen Real Estate, one of the largest investment managers in the world, with $127B of assets under management (as of 6/30/20).
The latest insights from Nuveen Real Estate’s market-leading global research team can be found at nuveen.com/global/thinking/real-estate.
—
NOTES
1. Moody’s Analytics, “Data Buffet,” Moody’s Analytics (May 2020), 2020, economy.com/databuffet
2. Moody’s Analytics, “Data Buffet,” Moody’s Analytics (May 2020), 2020, economy.com/databuffet
3. Scott Goldman, “US Energy and Employment by State,” US Department of Energy (2020)
4. Green Street Advisors (June 2020), greenstreetadvisors.com/atlas
5. United States Census Bureau, “2016 SUSB Annual Data Tables by Establishment Industry,” United States Census Bureau, census.gov/data/tables/2016/econ/susb/2016-susb-annual.html
6. Moody’s Analytics, “Data Buffet,” Moody’s Analytics (May 2020), 2020, economy.com/databuffet
—