
Despite acquiring multifamily properties at seemingly less attractive prices, corporate investors consistently outperform individual investors, which implies that proactive asset management including data driven approaches and real estate technology creates a competitive advantage.
Why do individual investors seem to fall behind, despite having greater agility and fewer dependencies than institutionalized investors?
Intuitively, individual investors have less information advantages and fewer economies of scale than corporate investment firms. The scale and specialization of large firms allow for the spreading out of data and research costs over many transactions (amortization), provide a platform for testing strategies to enhance value, and enable the use of incentivized compensation to align interests. However, these firms may be constrained by the requirement to maintain a specific investment focus or “stay in their lane.” This could result in a narrower range of outcomes and, theoretically, limit the potential for high returns.
Individual investors, while arguably lacking the institutional structure and processes of professional investment companies, may see higher upside due to the absence of investment restrictions and their alignment of incentives (i.e., they keep all profits). Conversely, they might be exposed to greater risks due to the lack of investment constraints. Thus, a higher variance in returns would be expected, with more outliers on both sides of the return spectrum.
These differences form part of the conventional wisdom within real estate investing. However, a historical shortage of data (and data analysis) in the sector allowed such mental models to continue unconstrained by the burden of proof. With a recent positive shift in data availability and scientific rigor, we can fact check these statements and expose them to sunlight, the results of which can inform a more robust investment process for individuals and firms alike.
In the interest of informing this process, this article provides an analysis of 22 years of multifamily transaction records (and an apples-to-apples transaction comparison), suggesting that individual investors materially underperform corporate investors . As we will show, the underperformance cannot be attributed to geography, property vintage, hold period, market timing, property size, or pricing (per square foot)—because all of these variables have been controlled for. Finally, we delve into the possible causes of this underperformance by individual investors and explore the implications of these findings.
METHODOLOGY
Our goal in this analysis is to generate a statistically significant volume of comparable transactions: each individual investor transaction paired with one corporate investor transaction. We control for various factors that may influence investment returns (e.g., property vintage, market timing, transaction year, price per square foot, portfolio transactions, location, and household income) so we attempt to arrive at a true apples-to-apples comparison.
A transactor is classified as an “individual” if the name in the grantor/grantee fields of a transaction record is that of a person or a company registered at a residential address. A transactor is considered “corporate” if it is a company registered at an address of a commercial property (an office or another commercial building). Our research shows that about 20% of all multifamily properties in the US are owned by individuals.
ACQUISITION PRICE EXPERIMENT
Our first question was: do individual and corporate investors acquire multifamily properties at the same price per square foot?
To answer this question, we constructed a parallel dataset of multifamily purchases made by individuals and by corporations (while controlling for key variables), and analyzed the difference in purchasing prices between the two groups. We ensured a robust and fair comparison by checking for potential selection biases.
We started with a dataset of all acquisition transactions on multifamily properties performed nationwide. We excluded small transactions (those with a price of less than $1 million) and removed transactions in non-disclosure states.1 We also removed transactions with price tags differing significantly (5x or more) from the property’s market value; those that differ might be non-market transactions which we do not want to consider. We then removed all bundle transactions that we managed to detect. We ended up with 42,300 transactions.
From these 42,300 acquisition transactions, we selected only those with populated (and sensible) values of the property size (at least 10,000 square feet), year built (which should be prior to the year of the transaction), and county where the property is located. For each census tract where the transacted property was located, we extracted the median household income value from the National Historical Geographic Information System (NHGIS) and associated the income value with the transaction. We split the resulting transactions to the 3,366 performed by individuals and 13,318 performed by corporations.
For each transaction made by an individual, we looked for a similar transaction made by a corporation, while controlling for:
- Acquisition year (the two transactions should be made in the same year, or at a one-year difference from each other);
- Location (the two transacted properties should be located in the same county);
- Year built (the two properties are built within 10 years from each other);
- Property size (up to two times larger or smaller from each other);
- Household income level in the neighborhood (up to two times greater or lesser from each other);
- Sensible price per square foot (prices per square foot for both properties should be in the range between $10 and $1000, to exclude overly cheap properties, extra luxury properties, and unreasonable cases or data issues).
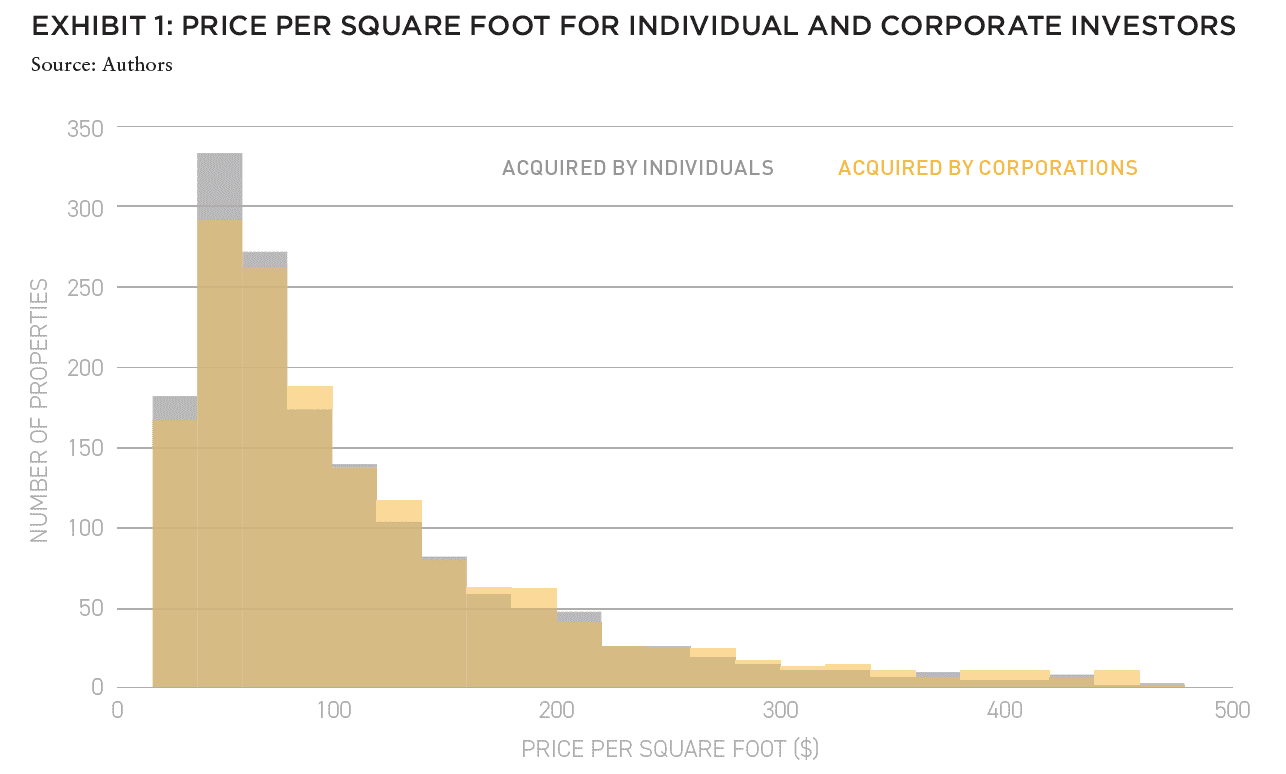
Once we applied this matching mechanism, we discovered that, on average, corporate acquisitions involved larger properties than those acquired by individuals. To accommodate for that, we randomly excluded some cases when the matching corporate acquisition was larger than the individual acquisition. We ended up with 1,635 acquisitions made by individuals and 1,635 matching acquisitions made by corporations. We then compared prices per square foot in both datasets (Exhibit 1).
We found out that, on average, individuals acquired multifamily properties at $118 per square foot (with standard error of the mean of $2.8), while corporations acquired properties at $128.4 per square foot (with standard error of the mean of $3.1). Median prices are $80.6 and $87.0 respectively. This implies that individuals tend to acquire cheaper properties, as compared to corporations.
We checked for possible selection biases and found none, noting that:
- Both individual and corporate acquisitions involved properties that were built around the same time (with an average year of 1979 and a median year of 1976, for both individual and corporate acquisitions).
- Both individual and corporate acquisitions are done over properties of roughly the same size. For individuals, the average size is 77,000 square feet, with the standard error of the mean of 2,000 square feet, and the median of 45,500 square feet. For corporations, the average size is 76,500 square feet, with the standard error of the mean of 2,000 square feet, and the median of 47,000 square feet.
- Both individuals and corporations made acquisitions in neighborhoods with similar household income (between $64,000 and $65,000 on average, with the standard error of the mean of $600, and between $60,000 and $61,000 as the median).
- In terms of location, the US state distribution of acquisitions made by individuals correlates well (r=0.76) with the overall US state distribution of multifamily properties (excluding non-disclosure states). By design, the US state distribution of acquisitions made by corporations is identical to that made by individuals (each property in one dataset is matched with a property of the same county in the other dataset).
REPEATED TRANSACTION EXPERIMENT
In the second experiment, our focus shifted to repeated transactions. Specifically, we analyzed properties that were both acquired and subsequently sold by individual and corporate investors.
We recorded acquisition and sale prices for both transactions and asked the question of whether investment returns of individuals are different from the investment returns of corporations. As previously, for each acquisition/sale pair of transactions done by an individual, we match an acquisition/sale pair of transactions done by a corporation.
We started with the same dataset of 3,366 transactions performed by individuals and 13,318 performed by corporations. The design of this experiment was almost identical to the design of the previous experiment, with an adjustment to the first control:.
acquisition year (the two properties should be acquired within 10 years from each other) and sale year (the two sale transactions should be made in the same year, or at a one-year difference from each other).
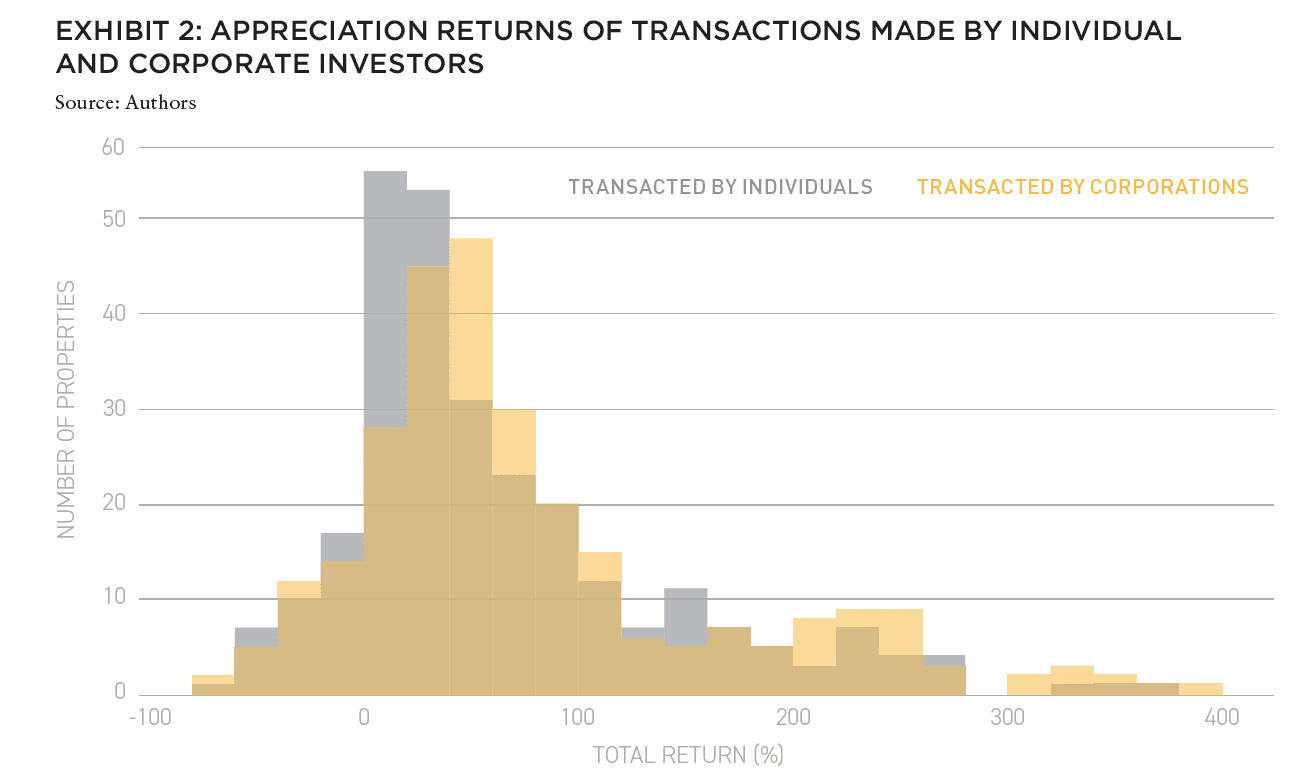
We discounted larger properties on the corporate side exactly in the same way as in the previous experiment. We ended up with 280 acquisition/sale pairs of transactions made by individuals and 280 matching pairs of transactions made by corporations. We then compared appreciation returns in both datasets (the sale price minus the acquisition price, divided by the acquisition price and multiplied by 100, to come up with percentages).
As shown in Exhibit 2, on average, individual investors had appreciation returns of 62.6%, with a standard error of the mean of 4.6% and a median of 38.8%, while corporate investors had appreciation returns of 79.1%, with a standard error of the mean of 5.3% and a median of 52.9%. Our results indicate that individuals generally earn significantly lower appreciation returns than corporations.
IN THIS ISSUE

NOTE FROM THE EDITOR: WELCOME TO #13
Benjamin van Loon | AFIRE
OFFICE TROUBLES: FINANCIAL RISKS AND INVESTING OPPORTUNITIES IN US CRE
Dr Alexis Crow | PwC + Byron Carlock
THE UNDERPERFORMANCE PARADOX: WHY INDIVIDUAL INVESTORS FALL BEHIND DESPITE BUYING LOW
Ron Bekkerman | Cherre + Donal Ward | Tenney 101
CLIMATE THREAT: EXTREME WEATHER IS THE NEW NORMAL FOR REAL ESTATE
Jacques Gordon, PhD | MIT
CLIMATE OPPORTUNITY AWAITS: HOW REAL ESTATE CAN INVEST IN CLIMATE ADAPTATION
Michael Ferrari, PhD and Parag Khanna, PhD | Climate Alpha
PREMIUM PRICE TAGS: INSURABILITY THROUGH PROPERTY RESILIENCE DATA
Bob Geiger | Partner Engineering & Science
REAL ESTATE WEB3: THE EMPEROR’S NEW CLOTHES OR THE NEXT BIG THING?
Zhengzheng Tan, Alice Guo, and Naveem Arunachalam | MIT
ADAPTIVE TO REUSE: COULD BUILDING CONVERSIONS BE DIFFICULT, EXPENSIVE . . . AND STILL PROFITABLE?
Josh Benaim | Aria
RENOVATE, REBRAND, REPOSITION: ADDING VALUE TO MULTIFAMILY THROUGH REVITALIZATION
Robert Kilroy, CFA | The Dermot Company + Will McIntosh, PhD | Affinius Capital
REDEFINING THE PROGRAM: A CONVERSATION WITH ARCHITECT DAVID THEODORE
Peter Grey-Wolf | Wealthcap + David Theodore | McGill University
SENIOR HOUSING UPDATE: EMERGING OPPORTUNITIES THROUGH DEMOGRAPHIC TAILWINDS AND DIMINISHING SUPPLY OUTLOOK
Robb Chapin, Jack Robinson, Andrew Ahmadi, and Morgan Zollinger | Bridge Investment Group
SENIOR HOUSING UPDATE: UNPRECEDENTED DEMOGRAPHIC ACCELERATION MAY DRIVE STRONG OPERATING FUNDAMENTALS AMID ECONOMIC SLOWDOWN
Tom Errath | Harrison Street
HOLIDAY FROM HISTORY: REASONS FOR US OPTIMISM IN A CHANGING GLOBAL ENVIRONMENT
Charlie Smith | Newmark
CRADLE TO CRADLE: AN ALLOCATOR’S VIEW ON IMPLEMENTING ESG INITIATIVES
Christopher Muoio and Katie Cappola | Madison International Realty
FREE LUNCH: MULTI-DIMENSIONAL DIVERSIFICATION IS A FULL-COURSE FREE MEAL
Elchanan Rosenheim and Tali Hadari | Profimex
CAMPAIGN MESSAGING: CFIUS, AFIDA, AND EXPANDING FEDERAL AND STATE RESTRICTIONS ON FOREIGN INVESTMENT IN US REAL ESTATE
Caren Street, John Thoms, and Anya Ram | Squire Patton Boggs
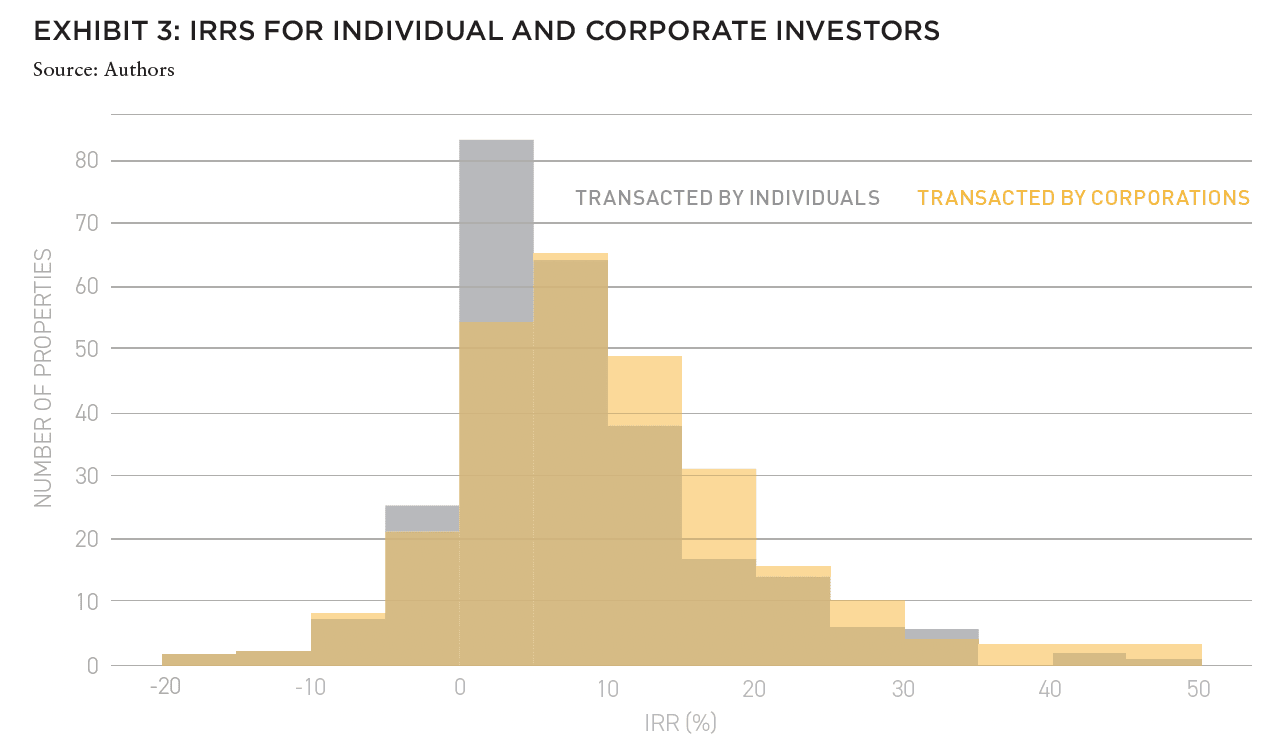
We proceeded with recording IRRs and saw similar results (Exhibit 3). The average IRR of individuals is 10.3% with the standard error of the mean of 1.1% and the median of 6.2%, while the average IRR of corporations is 12.8% with the standard error of the mean of 1.2% and the median of 8.5%. The IRR of individuals is significantly lower than the IRR of corporations.
We applied the same selection bias tests as in the first experiment, along with an additional test tailored specifically to this study:
- Property year of built is the same for both cases (average of 1980, median of 1978);
- Property sizes are similar (for properties transacted by individuals the average size is 91k sqft with the standard error of the mean of 5k sqft and the median of 55k sqft, while for properties transacted by corporations the average size is 92k sqft with the standard error of the mean of 5k sqft and the median of 53k sqft);
- Household incomes in the neighborhoods are practically identical ($61.7k and $61.8k on average and the median of $57.3k and $57.5k, for properties transacted by individuals and corporations, respectively);
- The distribution of transactions over the US States positively correlates with the distribution of multifamily properties over the US States (r=0.56). Although the correlation is lower than in the previous experiment (r=0.76), this can be explained by the fact that our dataset in the first experiment is almost 6 times larger than the dataset in this experiment;
- (NEW) The number of years properties were held by individuals and corporations, from the year of acquisition till the year of sale. Both individuals and corporations held their investment properties for a similar number of years (for individuals, the average is 7.1 years with the standard error of the mean of 0.3 years, while for corporations the average is 6.7 years with the standard error of the mean of 0.3 years). The medians are identical – 6 years – for both cases.
MARKET TIMING ANALYSIS
Corporate investors demonstrate significantly higher appreciation returns, both an IRR and an absolute appreciation basis. These higher returns cannot be explained by the aforementioned controlled variables. However, transaction timing, while controlled, adds some interesting nuances to the analysis.
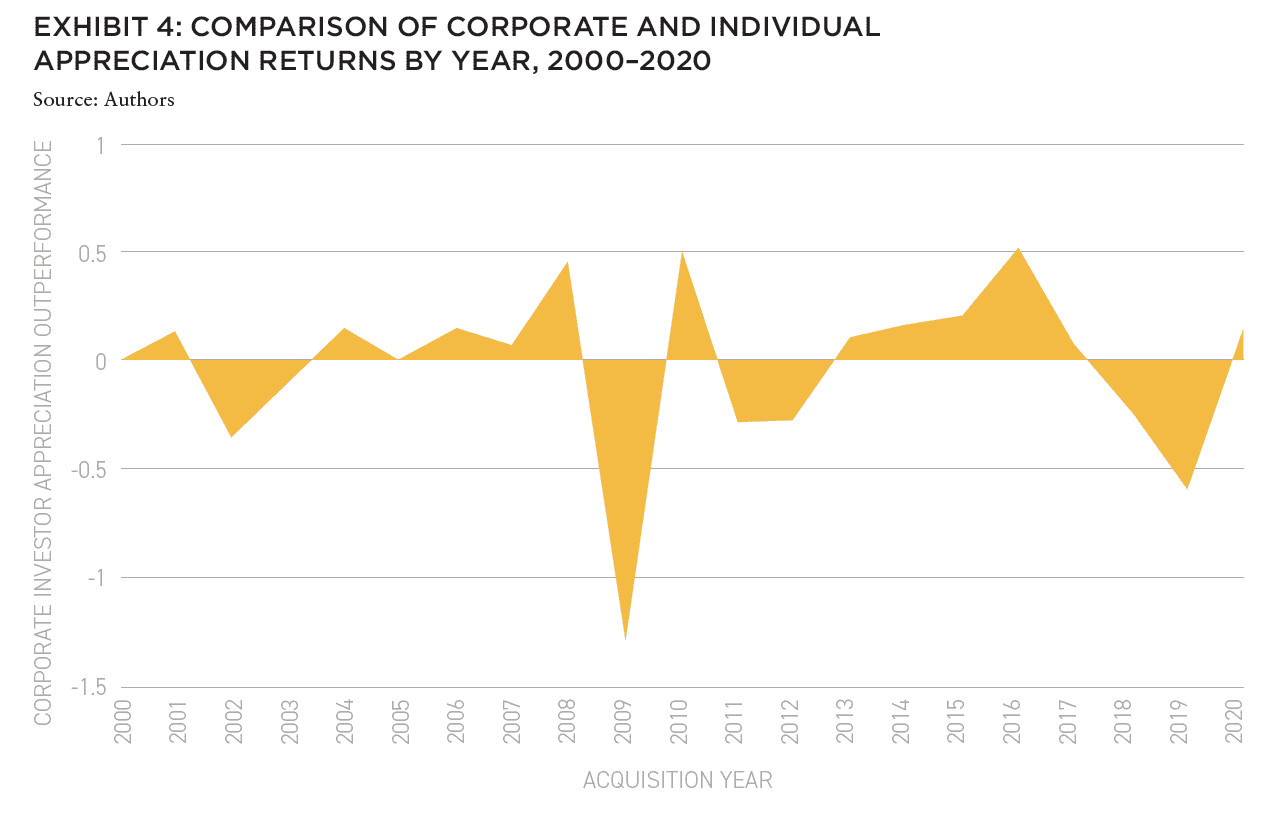
In Exhibit 4, the area above zero denotes the years in which corporate investors outperform individuals based on paired transactions. For instance, in 2006, properties acquired by corporate investors appreciated by 44% more compared to similar transactions made by individual investors. In other words, corporate investors experienced an average appreciation of 1.69 times, compared to 1.24 times for individuals.
The results indicate interesting observations regarding market timing. In 17 out of 22 years, corporate investors outperformed individual investors over similar properties. However, individual investors outperformed in five of those years—several of which corresponded to market troughs. These results could potentially illustrate the advantage individual investors may have due to their ability to reallocate capital unconstrained during periods of market distress or uncertainty. Overall, while individual investors demonstrated adeptness in timing their transactions, corporate investors appeared to leverage opportunistic asset management to achieve greater returns.
INDIVIDUAL VS. CORPORATE
The data highlights the significant outperformance of corporate investors when compared to individual investors. Such outperformance is material and consistent across time, and it cannot be attributed to any of the controlled factors.
Individual investors demonstrate, to the market (in part) and to themselves (in part), savvy timing, with acquisitions at lower prices per square foot and at periods of market dislocation. However, the end results do not correspond to the initial aggressive start.
Capital allocation professional can interpret these results in several ways and different questions emerge. What about the asset management fee load? Corporate investors typically charge an annual asset management fee and an incentive fee for returns above pre-defined hurdles. Our analysis does not account for these costs, which most likely drag down corporate returns. However, there is sufficient outperformance in corporate returns that further analysis is merited.
Additionally, our analysis only focuses on capital appreciation and doesn’t take income returns into account. Saying that, income returns are likely to be comparable, because we are controlling for vintage year, which is likely a key determinant of cash flow generation ability by asset. It can be the case that individuals rely on cash flow to generate their returns, rather than allocating available capital to improvement projects. Such income returns would need to be significant to move the needle and compensate for the underperformance on a capital appreciation perspective.
From this study’s insights, it is clear that multifamily investment firms may need to revisit their strategies. Institutional investors frequently outperform individual investors, underscoring the importance of structured operations, strategic planning, and skilled management. This is where the incorporation of data-driven approaches and real estate technology can create a competitive advantage. The authors of this study, having worked in a variety of multifamily investment, real estate data, and tech-intensive roles, have seen first-hand how innovative practices in market research, process optimization, and proptech utilization can lead to increased performance and value enhancement in such firms.2
REVIEWER RESPONSE
Ron Bekkerman and Donal Warde have tapped a database of 42,300 US multifamily (apartment) transactions, recorded over a 22-year period, to compare the investment performance of individual investors with that of corporates. What they found – using a repeat sales approach in which the sale price of an assert was compared with what the initial cost — was that corporate investors outperformed individuals, meaningfully, achieving total returns 26% greater than those of individuals.
These results occurred despite what the authors describe as the “greater agility and fewer dependencies” of individual investors versus institutions. And they run contrary to what the authors describe as conventional wisdom in real estate investing that individuals should outperform corporations due to the “absence of investment restrictions and their alignment of incentives (i.e., they keep all the profits).
Bekkerman and Warde’s methodology allows for an apples-to-apples comparison between institutional and individual transactions. They control for factors likely to affect total returns, including property vintage, market timing, year of transaction, price per square foot, location, and trade area household income.
Given the wide period over which the transactions occurred, the authors were able to extract a pool of repeat transactions – allowing for comparison of the sales price with the initial acquisition price. These repeat sales allowed for the total return comparison mentioned above.
They reviewed market timing as a factor, noting that individual investors did better than corporates in periods of market distress. But that corporates achieved significantly higher appreciation than individuals, outperforming in 17 of 22 years.
Why? They answer may lie in differences in what the investment goals and operating approach of the two groups. Individual investors often operate assets for stability of income, keeping them full rather than tolerating some vacancy in return for growth in in-place rents. This difference alone could explain the divergence in appreciation returns.
– Mary Ludgin, PhD
Senior Managing Director, Global Head Investment Research, Heitman
Member, Summit Journal Editorial Board
—
ABOUT THE AUTHORS
Ron Bekkerman is a Strategic Advisor for Cherre, a leading real estate data platform. Donal Warde is an Entrepreneur in Residence at Tenney 110, a startup venture studio within American Family Insurance.
—
NOTES
1 The current list of non-disclosure states is: Alaska, Idaho, Kansas, Louisiana, Mississippi, Missouri (some counties), Montana, New Mexico, North Dakota, Texas, Utah, and Wyoming.
2 For further research, we propose the examination of diverse asset classes, incorporation of income return estimates, and geographic segmentation of returns (e.g., coastal versus sunbelt markets).
—
THIS ISSUE OF SUMMIT JOURNAL IS PROUDLY UNDERWRITTEN BY

For more than 20 years, Yardi has developed real estate investment management software that helps managers of global assets valued at trillions of dollars make informed investment decisions. Yardi Investment Suite clients include many of the world’s premier investment management funds, start-ups and partnerships of all types and sizes.
Real estate investments grow on Yardi. That’s because the Yardi Investment Suite automates complex investment management processes and provides full transparency, from the investor to the asset. Through interactive dashboards, investors can view documents and have access to reports and metrics. Collaboration is easy when your advisor or accountant is given access to view your accounts, reducing the need for emailing sensitive information.
The Yardi Investment Suite leads the real estate industry through innovation and value with fully integrated investment management, property management and accounting functionality. Fund managers and their customers can manage assets with superior efficiency and ease. Learn more.