
This article appears in Summit Journal (Summer 2020) | Download PDF
Do people follow jobs, or is it the other way around? The answer depends on where we are in a business cycle.
During recessions, people tend to move towards markets where employment prospects are better, and as recoveries take hold, businesses usually expand into areas where people want to live. As the COVID-19 virus spreads around the world, it introduces a whole new dimension to the question: do people follow jobs, or do jobs follow people? Today, the answer is as much about public health as it is about the interplay of economics and demographics.
UNDERSTANDING RECENT MIGRATION PATTERNS
Global and domestic migration patterns are likely to be greatly affected by the pandemic. Investors should monitor these trends closely, because they can have major implications for economic growth and real estate fundamentals both across markets and within them (urban core vs. suburbs). In the US, migration is contributing to a growing regional divergence. Over the last five years, the South and West regions (mainly their metro areas with lower costs of living) accounted for more than 90% of the nation’s total population gain, whereas the Northeast experienced a net population loss.
This should be a concern for the nation’s gateway markets where institutional real estate investments are concentrated. Chicago, New York, and Los Angeles have experienced net population decline since 2015. Meanwhile, population growth in Boston, San Francisco, and Washington, DC, has been slowing progressively over the last decade and was only slightly positive last year. These changes were largely due to domestic migration, which has worsened notably in recent years. The Tax Cuts and Jobs Act of 2017 has likely accelerated these trends even further, as many of the people leaving these areas tend to earn higher incomes. Without continuing international migration, population trends in these areas would have been much worse. The current environment and substantial limitations on foreign travel pose new headwinds—at least in the near term.
Exhibit 1: Average Annual Domestic Migration (Thousands)
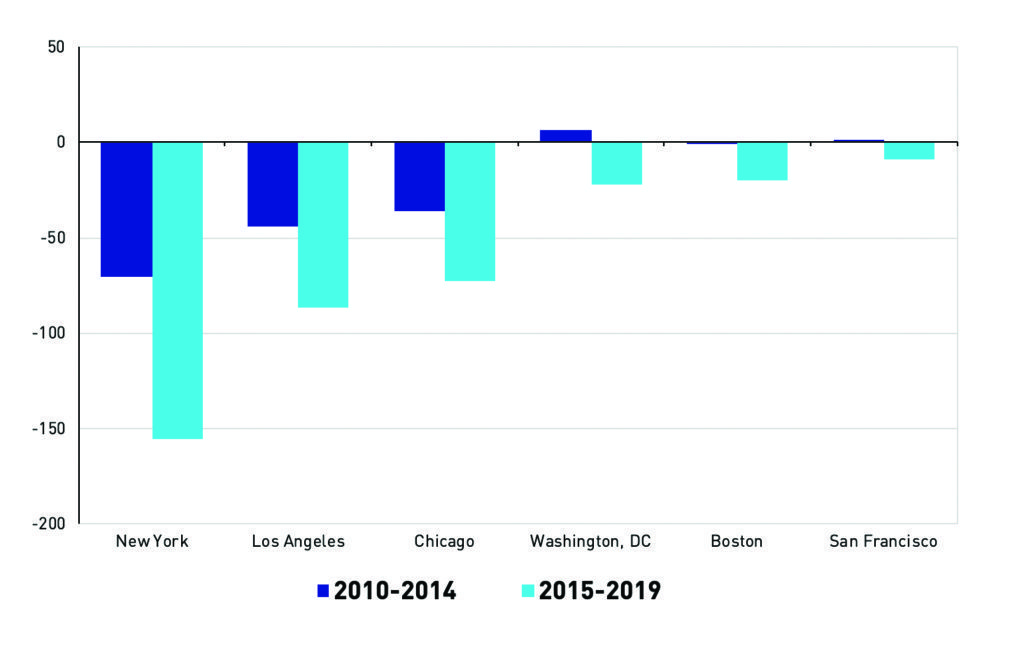
People are leaving these markets for many reasons, but mainly because of the high costs of living and high taxes. The latter will likely remain a headwind for a while. This recession will likely put significant pressure on state and local finances nationwide, but especially in many parts of the Midwest, the Northeast, and California, which faced serious fi scal imbalances even before the crisis. Additionally, the rapid increase in the share of retirees relative to the working population will also make it more challenging to fund various health programs and public pensions. The “silver tsunami” is just starting and this demographic shift is one of the factors making the next business cycle quite different from the ones we have experienced in recent decades. A wider spread of telecommuting in the post- COVID economy could also speed up the migration towards lower-cost markets and suburban submarkets.
Migration matters because it is one of the key drivers of overall population growth, which in turn has a major impact on the labor force. In addition to the industry composition of local economies, migration is a key differentiating factor for local job growth. The table below shows average annual net birth and migration rates along with changes in population and employment over the last five years for the 60 major metro areas tracked by Berkshire Research.[1]
Exhibit 2: Birth, Migration, Population, and Employment: 2015–2019
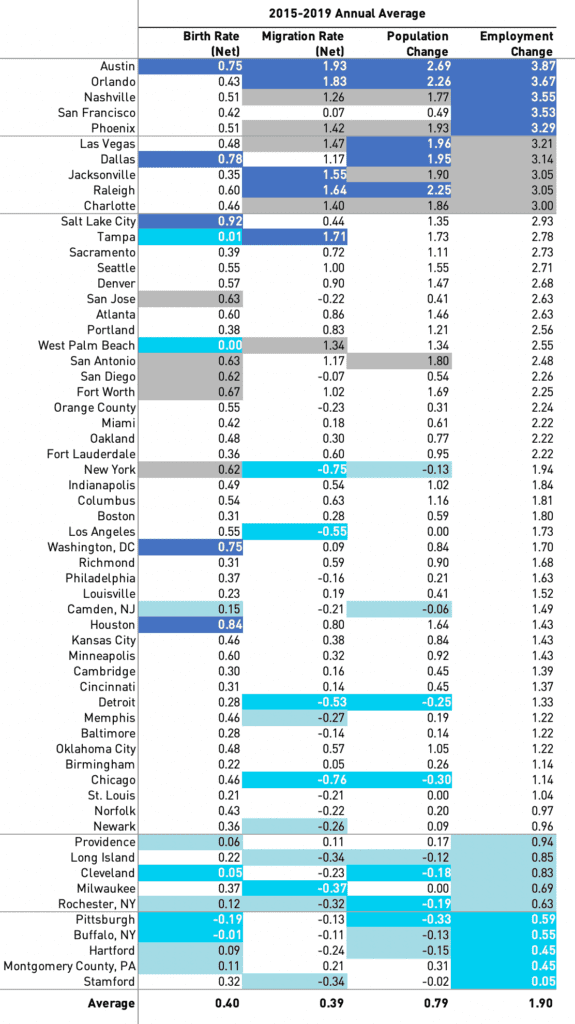
Across these markets there was an over 95% correlation between net migration rates and population growth and an over 80% correlation between population and employment growth. All of the top ten markets for job growth were in the South and West regions and virtually all of them were also in the top ten for migration rates. Meanwhile, all of the bottom ten markets for job growth were in the Northeast and Midwest and they had negative or near-zero net migration.
For the most part, what happened over the last five years was a continuation of trends that were at play before, but net migration is and will be playing an increasingly important role as a demographic driver relative to the natural population growth, especially as the population ages. This is not surprising since the U.S. birth rate has not recovered following the Great Recession and was at its lowest level in 35 years in 2019, while the death rate has edged up slightly.
MIGRATION TRENDS AND RENTAL HOUSING
Migration is particularly relevant to investors in rental housing not only regarding the net figures but also to the actual flows of people moving in and out of markets (also known as the “churn”). Negative net migration does not mean that people are moving out, but rather, that the number of people moving out exceeds the number of people moving in, and vice versa. For example, while Chicago is indeed experiencing negative migration, more than 150,000 people are still moving into the metro area each year from other parts of the state and the country. One of the key factors, however, is the demographic and income profile of the people moving out of a market relative to those moving in.
This is important because 70% of all people who migrate each year are renters prior to their move and are likely to continue renting in the first year after the move. What type of rental housing they move out of in one market and move into in another has implications for demand in both areas, including single-family vs. multifamily, urban vs. suburban, class A vs. B, and so forth.
Exhibit 3: Migration Trends In Austin, TX and Orlando, FL
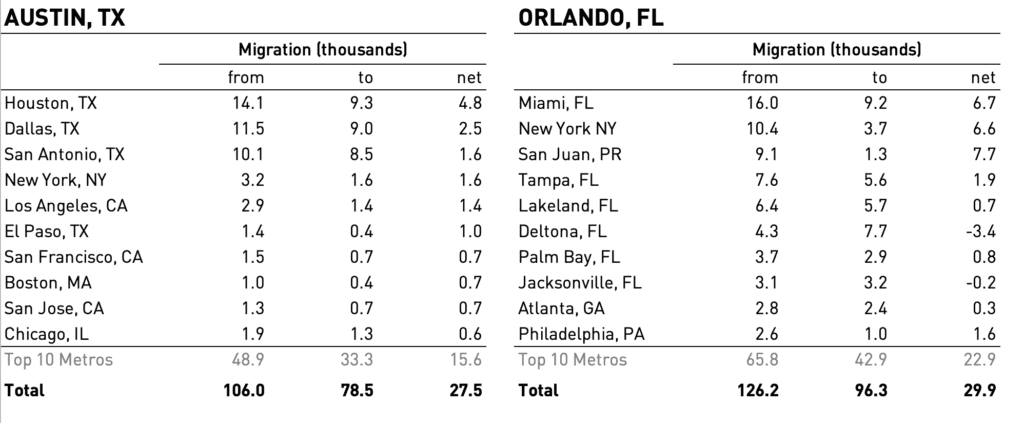
Let’s take a closer look at Austin and Orlando, which have the highest net migration rates and similar population counts. Exhibit 3 shows the top 10 metro areas from which people are moving into each of these two markets. While the total net migration figures are similar, there are some major differences in the composition of people moving in. Austin draws people from all four regions of the country, including most gateway markets. Many people migrating to Austin are moving from areas with notably higher incomes and costs of living. In contrast, the regional composition of people migrating to Orlando is much less diverse, with most markets being in Florida and Puerto Rico. Additionally, Orlando’s net migration is much more concentrated in the top ten markets while Austin’s is more dispersed across markets.
While net migration figures are a very important part of the story, one should also look at the underlying drivers to get a more complete picture of the potential impacts on the rental market. The composition as well as durability of rental demand growth due to net migration in Austin and Orlando are likely to be quite different and this should be considered when evaluating the two markets.
THE FUTURE OF MIGRATION
Migration is a key factor driving the differences both in rates of population growth and its composition. It is currently hard to say how the pandemic might affect both domestic and international migration in the United States. What we do know is that these trends will become even more critical not only over the next year, given more limited travel due to health concerns and unprecedented job losses, but also long-term as the population ages. It is also clear that migration flows will be greatly affected by how different markets are impacted by the pandemic and the recession.
—
ABOUT THE AUTHOR
Gleb Nechayev, CRE, is Head of Research and Chief Economist, Berkshire Residential Investments, a people-focused investment management company known for its vertically integrated organization and experience in US residential real estate.
NOTES
1. Net migration rate is the sum of domestic and international migration as a share of total population. Net birth rate is the difference between births and deaths as a share of total population. Markets in the table are sorted by average annual changes in total employment over 2014–2019 period.
—