
Dive into the report to understand if and how COVID impacted domestic migration patterns on a state, city, and zip code level.
[READ THE ORIGINAL WHITE PAPER AT PLACER.AI]
The United States is one of the most geographically mobile countries1 in the world. FiveThirtyEight2 states that the average American moves an average of eleven times in his or her lifetime, and while it is hard to find accurate data on other countries, research suggests that they don’t move quite as much.3 There are many factors that drive these high rates of internal migration— unlike the European Union, all of the US speaks the same language, meaning that relocating for a work opportunity across the region is easy for someone moving from Florida to Washington State. Moving from Romania to Portugal—not as simple
These migration trends were thrust into light as COVID began to take hold. The sudden option to work from home also led to questions about where people would live if commuting to an office was no longer a necessity. Many assumed that there would be mass exoduses from cities as people,4 feeling constrained by lockdowns, would seek outdoor space.
Foot traffic data tells a slightly different story. While some people made big moves, most stayed in place. Others moved but stayed close to their region of origin. And many of those who did relocate across state lines chose areas whose population had already been trending up pre-pandemic.
Still, moving is expensive,5 time-consuming, and emotionally and socially costly, so even a slight uptick in internal migration is significant. This whitepaper examines some of the population shifts within the United States over the past few years. We looked at population changes on a state, county, and zip code level to understand if and how COVID impacted these trends and where migration patterns are headed.
COVID DIDN’T UPEND MIGRATION PATTERNS
The beginning of the pandemic saw many think-pieces predicting6 that the areas in which Americans would choose to live would forever be changed. But taking a wider view and looking at the population shifts since 2018 shows that—with some exceptions —much of the migration over COVID followed trends that had already been taking place.7
According to around 30 million change-of-address requests to the US Postal Service in 2020 analyzed by the New York Times,8 migration patterns during the pandemic mostly looked a lot like migration patterns pre-pandemic. Certain smaller metro areas and vacation spots became more popular, and some larger cities did see their population decrease. But overall, areas that were already attracting new residents kept growing, and those that were already losing residents lost more.
The change in net population across states between Q1 2021 and Q1 2022 (shown in the top left map below) stayed between the range of -0.9% (in Illinois and New Jersey) and 2.3% (in Idaho). Even when we compared the population in Q1 2022 to Q1 2019 and Q1 2018, the changes still remained relatively small in most states. And the states that did see more substantial population growth in the past 3 to 4 years are states with a more rural and sparse population like Idaho (12.2% population growth since Q1 2018) and Montana (7.7% population growth since Q1 2018) where populations were small to begin with—so even a slight increase is likely to have a dramatic impact on the population rates.
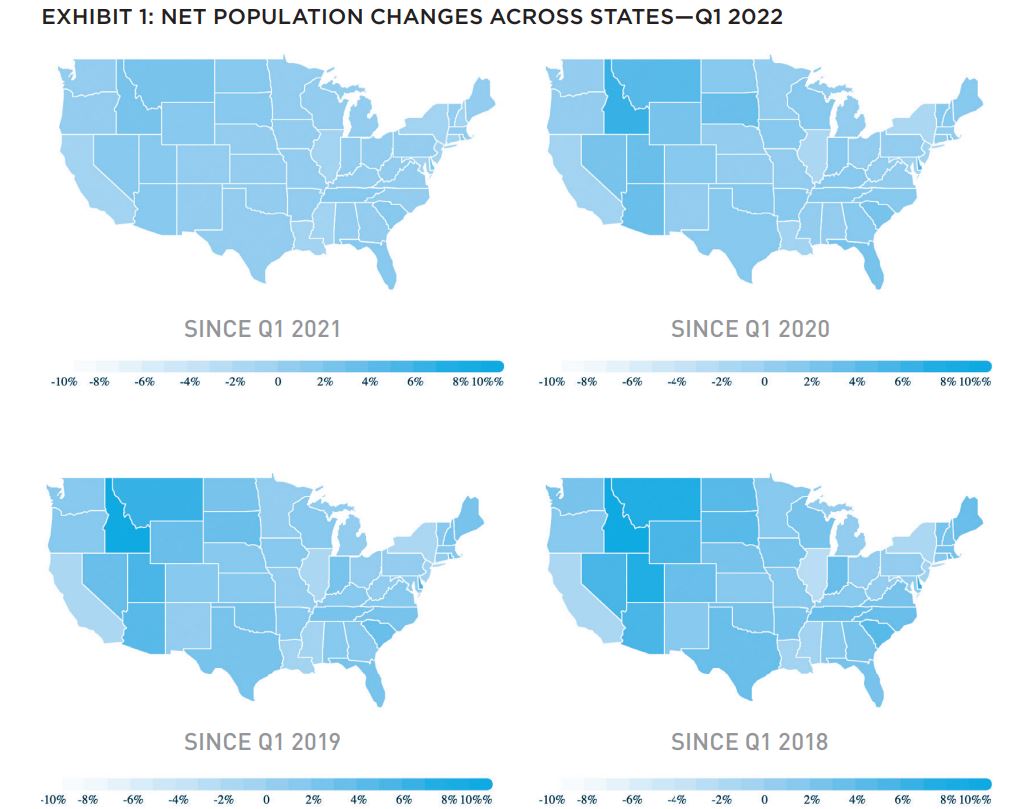
But while the pandemic did not necessarily change the direction of internal migration, COVID may have accelerated some trends already in place. Several states with large urban populations saw their populations shrink somewhat, with New York, Illinois, and California all seeing gradual declines in population of 1.1%, 2.2%, and 1.1%, respectively, since Q1 2018. And some cities with dense office areas also saw declines in population as remote work became the norm.
But whether people relocated because of COVID or because of factors and trends already in place pre-pandemic, the data does show that a small, but significant, share of the population has moved across state lines since 2018. And since moving out of state9 is both expensive and labor intensive, families and individuals with the resources available make up a very specific demographic that can have an outsized impact on foot traffic to dining, retail, recreation, health, and cultural venues.
THE STRONG GOT STRONGER
Our data, illustrated in the two graphs below, shows that areas that were already attracting new residents throughout 2019 continued to do so during the pandemic. Florida and Arizona, two states known for typical winter population surges as “snowbirds” arrive, have seen their winter population increase every year since 2019. The populations of Texas and Colorado have also been trending up for years.
But the pandemic also caused some declines in states with pre-pandemic stagnant populations such as New York, Illinois, and California. So while COVID did not reverse any growth trend, not all the relocation patterns seen over the past two years started before 2020. Still, it’s important to note that the population declines in previously stagnant states were generally smaller than the equivalent increases in the growing states. This means that the trends that were already in place on the eve of the COVID outbreak generally had a larger impact on population patterns.

At the same time, a positive or negative 2% to 4% change in statewide population over three years may seem small, but it is still significant. And the chart below indicates that not only were some of these trends in place pre-COVID—the trends continued in 2021 even after many of the pandemic-related restrictions eased up. Arizona, Texas, Florida, and Colorado saw an increase in population between January 2021 and January 2022, while California, New York, and Illinois saw their populations decrease slightly. Should these shifts continue, the impact on everything from housing supply to city planning to retail performance could be dramatic.
COUNTRY-LEVEL MIGRATION TRENDS
On a more granular level, certain counties saw their growth trends accelerating—or decelerating. But as will be discussed further down, much of the migration in and out of cities is intraregional migration—people moving from suburbs to cities or people moving from cities to surrounding areas while remaining rooted around their city of origin.
AUSTIN AND BOULDER
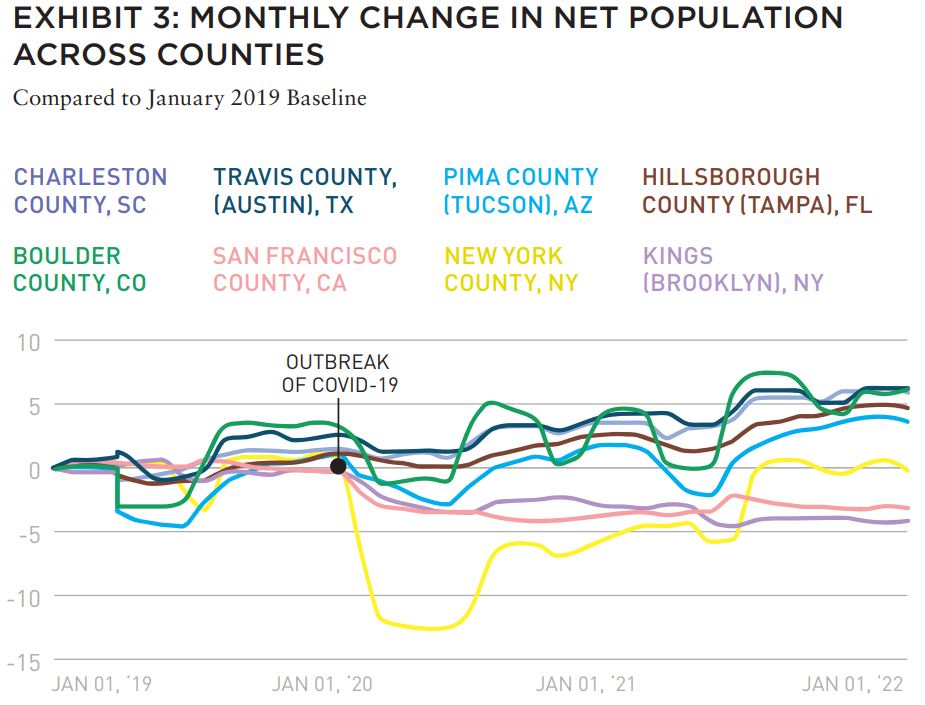
Both Travis County, Texas (Austin) and Boulder County, Colorado, have seen their populations expanding over the past few years. Austin has been the fastest growing major metropolitan city in America for nine years straight, adding an average of 169 new people per day10 between 2018 and 2019. This has led to an explosion of investments into the city’s hi-tech infrastructure, building, and commercial retail, with many companies choosing to open campuses there, including tech giant Apple. Meanwhile, Boulder, ranked as the best place to live in America in 2021, has seen its own hi-tech investment, with Google setting up a hub there in 2006.11 Since then, Google has continued to expand in the area—always a draw for a growing city.
The presence of these tech behemoths helped spur already existing migration trends and cemented these areas as attractive, up-and-coming cities for young professionals. The net population of these two counties—along with the population of Texas and Colorado— continued to rise over COVID. By April 2022, their net populations were 3.6% and 6.1% higher for Austin and Boulder, respectively, than they were in January 2019.
PANDEMIC-INDUCED MOVES
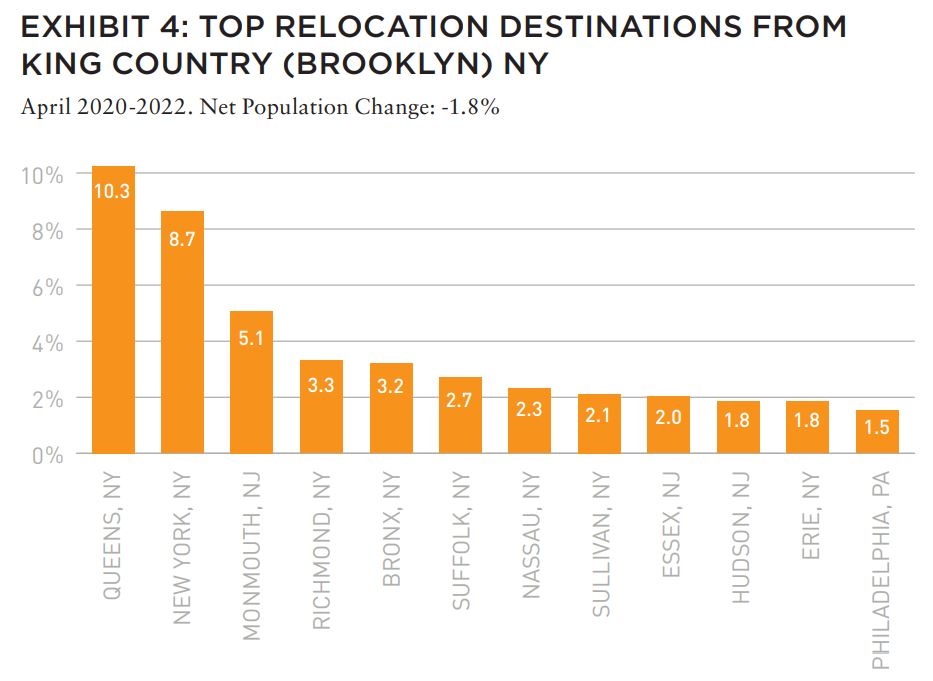
Some areas did see their population numbers drop as a direct result of the pandemic. The New York City area saw many leaving, whether to upstate New York or to other nearby regions. And while most of the population of Manhattan (New York County) seems to have returned to the city, the population of Brooklyn (Kings County) was still down 4% year-over-three-year (Yo3Y) in April 2022. Another famously expensive city, San Francisco, also saw its population drop—and as of April 2022, the population of San Francisco County was 3.1% smaller than it was in January 2019.
So while the excitement of living in Manhattan seems to have been enough to bring residents back from their COVID-induced exodus, other urban areas haven’t fared as well. The data in this section may indicate that large, well-established cities are facing increasing competition from up-and-coming centers with increasing employment opportunities, accessible nature, and affordable housing.
It’s also important to note that many of those leaving larger cities are choosing to settle in smaller urban or suburban areas nearby. Many of those leaving Brooklyn, for instance, have relocated to Upstate New York, New Jersey, or Connecticut so that they still maintain a connection with their original city. These people may frequently return to New York to go to the office, meet friends, or shop. So the migration out of major urban areas may shift, rather than eliminate, some of the demand for dining and retail options in those cities with shrinking populations.
SUBURBAN FOLKS MOVING TO THE BIG CITY
Much of the internal migration over COVID was intra-regional migration (migration within a given state). And despite the popular pandemic narrative of everyone moving out of the city to the suburbs, the data shows a different reality. Over the past two years, many people moved to cities—or to growing neighborhoods within cities—in search of convenience, job opportunities, and social connection. So while some major cities saw population declines, a lot of up-and-coming urban areas have been growing. And notably, a majority of incoming residents to these growing urban areas are coming from the surrounding regions.
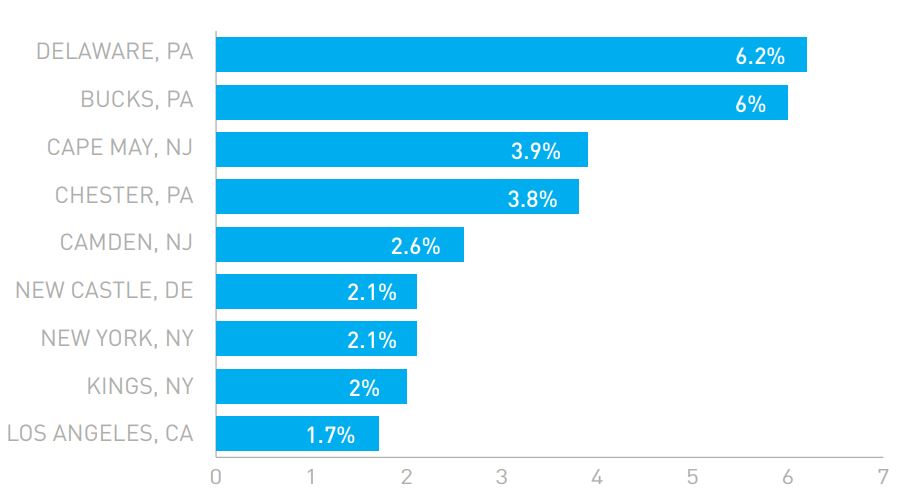
PHILADELPHIA, PA
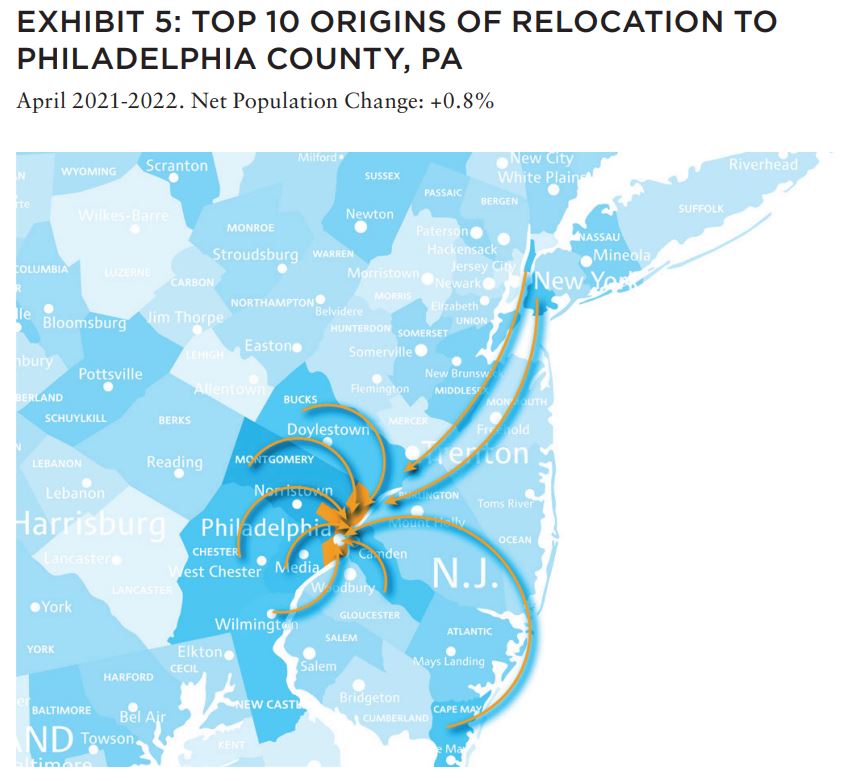
After remaining steady throughout most of the pandemic, Philadelphia’s net population grew 0.8% between April 2021 and April 2022—a small but significant increase for a city of over 1.5 million. As the chart below illustrates, many of the newcomers came from surrounding states and counties. Perhaps this is due to the city being ranked one of the top 30 tech hubs12 in the world in 2021.
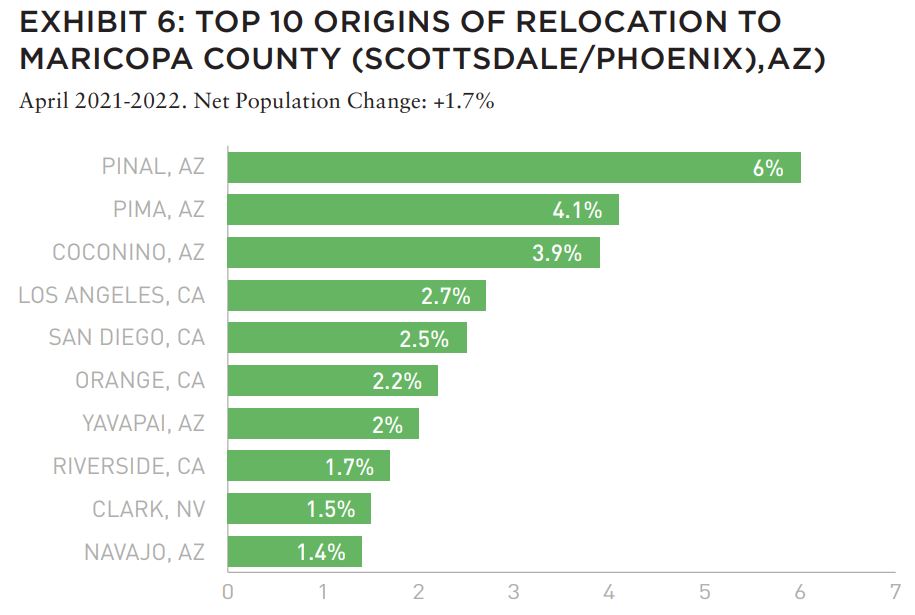
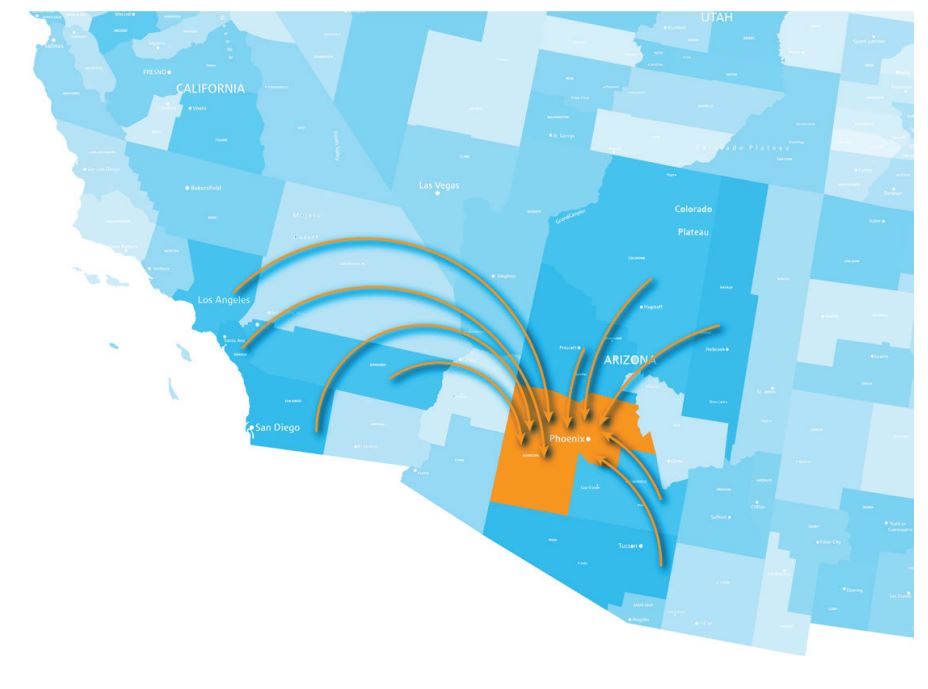
PHOENIX, AZ
Maricopa County in Arizona is home to Phoenix, the state’s largest city with over 1 million residents. The county had the largest population growth in the United States between July 2020 and July 2021.
Between April 2021 and April 2022 Maricopa County boasted a net population increase of 1.7%. Like with Philadelphia, many of the new residents came from nearby—some from the surrounding suburban towns, with others moving to Maricopa Country from neighboring California and Nevada.
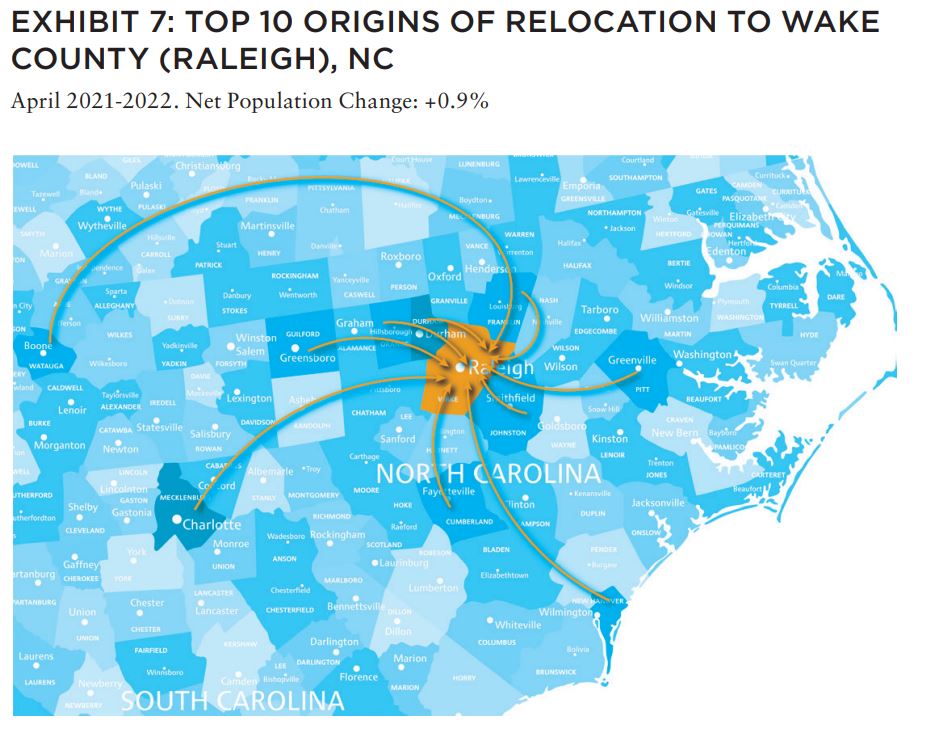
RALEIGH, NC
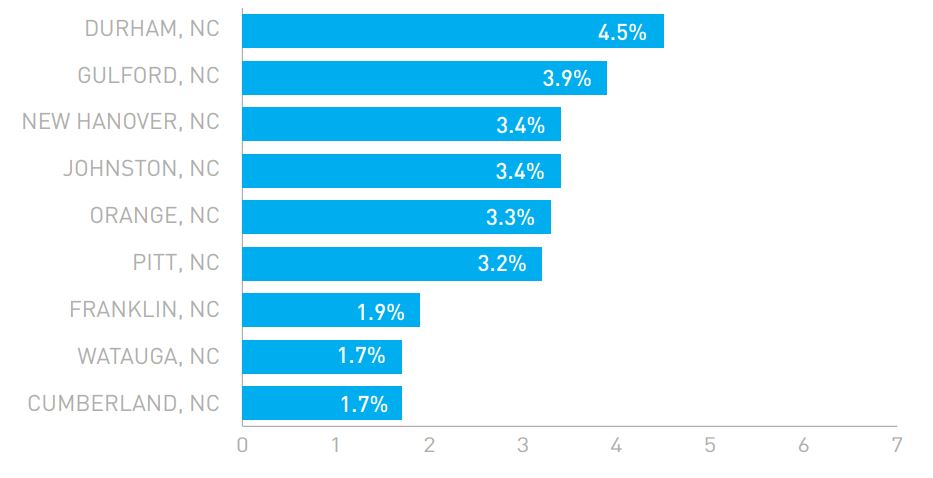
Wake County, North Carolina, includes the city of Raleigh, which recently ranked as one of the best places to live in the United States. The county also saw an impressive 0.9% net population growth over the past year. Many of those relocating to Wake County came from nearby suburban areas—the top 10 origins of relocations all were nearby counties in North Carolina.
CHICAGO’S FULTON MARKET
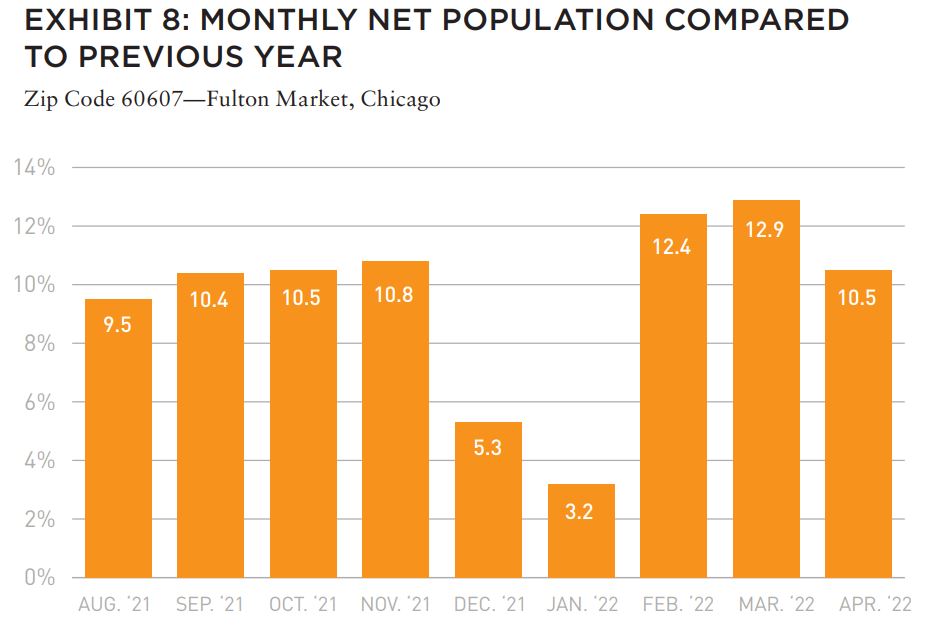
Once known as a gritty meatpacking district, Fulton Market in Chicago is a perfect example of an area that has shifted rapidly over the past few years. Although Chicago’s overall population decreased during COVID, Fulton Market saw explosive growth, with large residential and office space13 expansions plans in the works. And there are no signs that these trends are slowing down, with more and more offices, shops, restaurants, and up to 9,000 residential spaces coming to the area.
Urban development can also be significantly affected by changing demographics and migration patterns. Cities are constantly changing and shifting based on population demographics, work opportunities, and cultures. As these shifts take place, the changes that stem from them can exert a large influence on things such as urban planning, infrastructure investment, housing, and the layout of a city.
Understanding who is moving to a neighborhood helps developers and city planners anticipate the needs of newcomers to provide relevant services, retail options, and restaurants. It also provides a critical lens for the retailers and restaurant operators themselves, helping to uncover opportunities to reach key markets at the earliest possible stage. Cities that successfully adapt to fast-paced population shifts are ones that keep track of the changes happening at county, district, and even zip code levels in as close to real time as possible.
Google’s presence is only expected to become more entrenched with its planned expansion of the Fulton Market offices.25 And while a return to full-time office life may not happen in the near future, the company has required its staff to return to the office three days a week—an incentive for these workers to choose to settle in the area and not leave the city. And Google isn’t the only company setting up shop in the Fulton Market area—John Deere has also announced that they are creating their technology center in Fulton Market, joining Dyson and Glassdoor in relocating to this trendy area.
GENERATIONAL SHIFTS
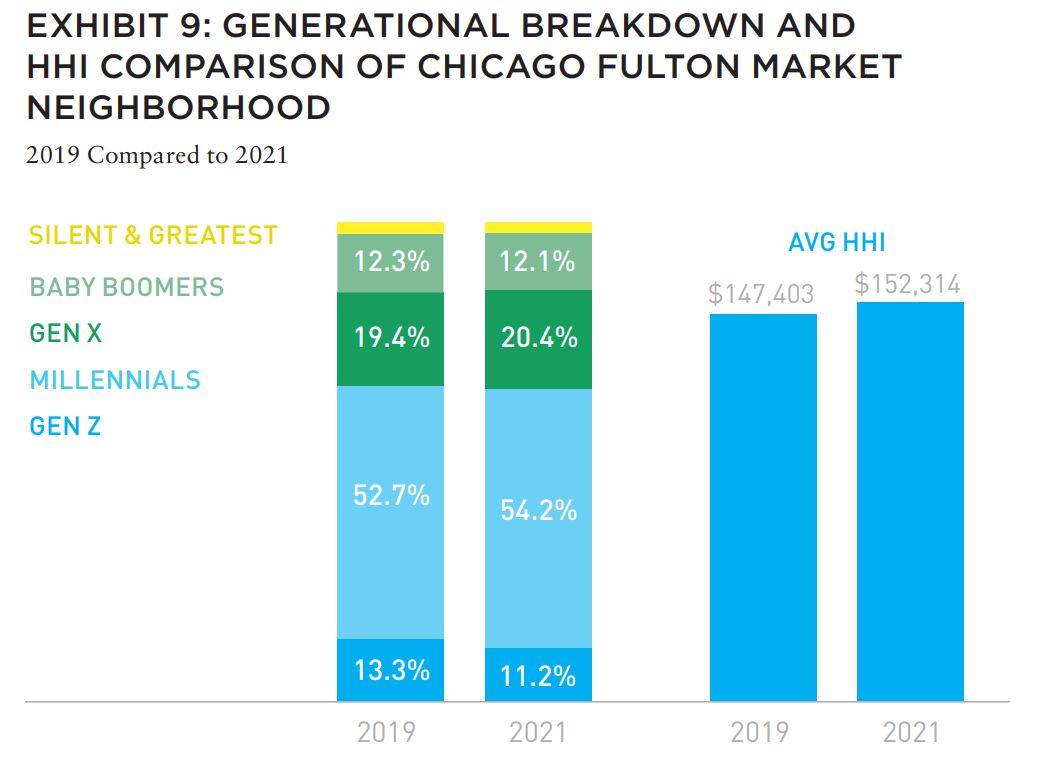
Zooming into the population data shows that aside from increasing rapidly in size, the generational breakdown of the Fulton Market is shifting as well. Using the 2019 ACS Census data to compare 2019’s age brackets with those of 2021 shows that the portion of Gen Z’ers—or those born between the late 90’s until the early 2010’s—decreased from 13.3% to 11.2%, while the population of Millennials increased from 52.7% to 54.7%. Gen X, or those born roughly between the late 60’s to early 80’s, have also increased their presence in the area, making a 1% jump from 19.4% to 20.4%.
These shifts can indicate that, as demand for apartments in the area grows and Fulton Market becomes more established, younger generations starting out on their professional journeys may no longer be able to afford to live in the area. Although younger residents may have helped turn Fulton Market around, the neighborhood’s character is changing again, with older Millennials and Gen X’ers with established careers are now giving the area a new vibe.
Taking a look at the average household income of the neighborhood’s residents also buoys the idea that more established residents are moving to the area. Between 2019 and 2021, the average HHI increased from $147,403 to $152,314. The increase in HHI levels and the increase in established residents can very likely be attributed to the large pull that the strong tech industry in the area provides for upwardly mobile professionals.
CHANGING DEMOGRAPHICS, CHANGING RETAILERS
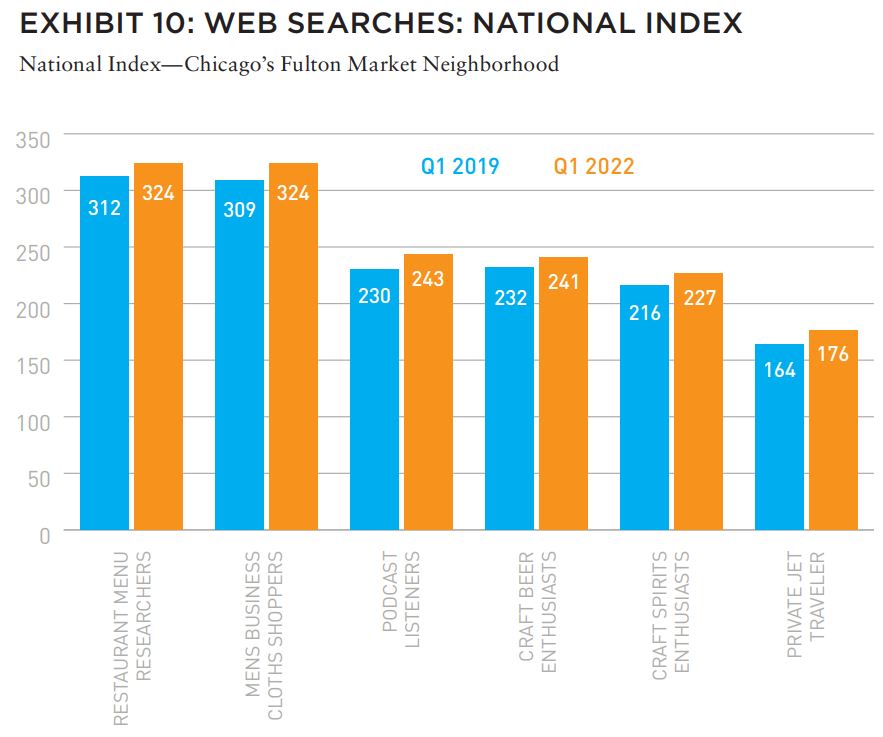
Changing demographics don’t only affect things like age and household income—it also affects lifestyle choices and consumer preferences. Using GeoWeb14 data on the Placer.ai platform, we took a look at search categories from Fulton Market to identify changes in local consumer interests. In the graph below, any search category with an index score over 100 indicates an above-national-average interest.
In September 2021 it was announced that Fulton Market will also be home to the country’s second Guinness Brewery, fitting for a neighborhood that has seen its search index for “Craft Beer Enthusiasts” increase from an index of 232 to 251 between Q1 2019 and Q1 2022. Similarly, searches related to “Men’s Business Clothing” also saw increases in web searches, presumably as the blossoming tech industry brings more workers to the area.
MIGRATION WAVE MAY NOT BE OVER
Many of the patterns explored in this white paper are trends that preceded COVID. The pandemic accelerated some of these trends, while also causing some small but significant changes to internal migration in the United States. And critically, looking at changes in populations since 2021 indicates that the internal migration may not be over.
For most people, the default is still to stay in place, so the decision to move is a lengthy one that takes many months, or sometimes even years, to come together. Many of those who have not yet moved may be thinking about it, weighing their options, or waiting to see whether the shift to remote and hybrid work will remain in place post-COVID.
One thing, however, is certain. Those that have already relocated over the past two years—whether across state, city, or even zip code lines—will likely continue having a major impact on civic stakeholders’ and business leaders’ decision making for years to come.
KEY TAKEAWAYS
- COVID didn’t upend migration patterns. While COVID did have a small but significant impact on relocations, much of the internal US migration over the past two years followed trends already in place pre-pandemic. Nevertheless, there were some exceptions, such as decreasing populations in some particularly expensive urban areas such as San Francisco and increasing population in other up-and-coming cities such as Charleston and Tampa.
- Many of those who did leave the city stayed close by. Many of those who left cities during or after the lockdowns relocated to nearby towns or counties. Brooklyn, for example, saw its population drop by 1.8% between April 2021 and April 2022, but many of those who left the borough stayed in New York City—10.3% of those leaving Brooklyn last year moved to Queens, and 8.7% moved to Manhattan.
- Popular states got stronger, some stagnant states lost populations. Cities and states whose popularity was rising pre-COVID continued to grow, while some more stagnant areas saw their populations decline. Florida, Texas, and Arizona saw their populations increase by 2% to 4% since 2019, while New York and California saw declines of 1% to 2% during the same period.
- Most migration was intra-regional. Many Americans who chose to move stayed local. Smaller metropolitan areas, like Philadelphia, Raleigh and Phoenix saw significant jumps in their population sizes, with most of the people moving to these cities from surrounding suburbs.
- Neighborhoods can create their own economic and residential reality. Ultra-local migration does not always follow the patterns of the wider region. For example, Fulton Market in Chicago is growing fast, even as Illinois’ population somewhat declines. Retail and business investment has transformed the area from an up-and-coming neighborhood to an expensive, exclusive district with an older, wealthier population—a testament to the potential of neighborhoods to create their own economic and residential reality.
—
ABOUT THE AUTHORS
Ethan Chernofsky is the Vice President of Marketing for Placer.ai, a foot traffic analytics platform that uses cell tower data to count shoppers in stores and retail centers around the US.
—
NOTES
1 Neli Esipova, Anita Pugliese and Julie Ray. “381 Million Adults Worldwide Migrate Within Countries.” Gallup.com. Gallup, August 16, 2021. https://news.gallup.com/poll/162488/381-million-adults-worldwide-migrate-within-countries.aspx.
2 Chalabi, Mona. “How Many Times Does the Average Person Move?” FiveThirtyEight. FiveThirtyEight, January 29, 2015. https://fivethirtyeight.com/features/how-many-times-the-average-person-moves/.
3 “Why Do Americans Move So Much More Than Europeans?” Santa Fe Relocation, June 21, 2019. https://www.santaferelo.com/en/moving/news-and-blog/why-do-americans-move-so-much-more-than-europeans/.
4 Altucher, James. “NYC Is Dead Forever… Here’s Why.” James Altucher, August 14, 2020. https://jamesaltucher.com/blog/nyc-is-dead-forever-heres-why.
5 Allen, Samantha. “Average Moving Costs Increased from 2020 to 2021.” Forbes. Forbes Magazine, September 28, 2022. https://www.forbes.com/home-improvement/moving-services/moving-prices-increase/.
6 Fisher, Marc, Paul Schwartzman, and Ben Weissenbach. “The Great American Migration of 2020: On the Move to Escape the Coronavirus.” The Washington Post. WP Company, March 30, 2020. https://www.washingtonpost.com/politics/coronavirus-great-american-migration/2020/03/28/b59d4d44-6f6f-11ea-a3ec-70d7479d83f0_story.html.
7 Martin, Emmie. “Americans Are Fleeing the Most Expensive US Cities and Moving to These 10 More Affordable Places.” CNBC. CNBC, February 20, 2020. https://www.cnbc.com/2020/02/20/americans-fleeing-expensive-us-cities-and-moving-to-these-affordable-places.html.
8 Kolko, Jed, Emily Badger, and Quoctrung Bui. “How the Pandemic Did, and Didn’t, Change Where Americans Move.” The New York Times. The New York Times, April 20, 2021. https://www.nytimes.com/interactive/2021/04/19/upshot/how-the-pandemic-did-and-didnt-change-moves.html.
9 Nicastro, Dom. “Is Austin Emerging as the New American Technology Hub?” CMSWire.com. CMSWire.com, August 20, 2021. https://www.cmswire.com/customer-experience/is-austin-emerging-as-the-new-american-technology-hub/.
10 Gershon, Eric. “How Google Came to Boulder.” Alumni Association, January 7, 2019. https://www.colorado.edu/coloradan/2018/03/01/last-how-google-came-boulder.
11 Dean, James. “Pandemic Prompted Exodus from New York City, Gains Upstate.” Cornell Chronicle. Cornell University, March 24, 2022. https://news.cornell.edu/stories/2022/03/pandemic-prompted-exodus-new-york-city-gains-upstate.
12 Kanik, Hannah. “Philly Among the Top 30 Cities Worldwide for New Companies, Startup Genome Says.” PhillyVoice, September 23, 2021. https://www.phillyvoice.com/philadelphia-ranked-top-30-cities-best-startups-globally-tech-life-sciences-gopuff/.
13 Gallun, Alby. “Chicago Fulton Market Development Would Include Offices, Apartments.” Crain’s Chicago Business, January 12, 2022. https://www.chicagobusiness.com/commercial-real-estate/chicago-fulton-market-development-would-include-offices-apartments.
14 “Geoweb Data by Spatial.ai.” Spatial.ai. GeoWeb. Accessed October 4, 2022. https://www.spatial.ai/data/geoweb.
EXPLORE THE LATEST ISSUE

CAPITAL MARKETS PULSE
Through the rest of this year, investors forecast challenges for global capital, but thoughtful investors are forging ahead.
Gunnar Branson and Benjamin van Loon | AFIRE
ON/OFF SWITCH
While the market rarely sends clear investing signals, current market conditions are replete with clues, but as timing for corrections is difficult, a move to risk-off strategies could be useful.
Joseph L. Pagliari | University of Chicago
MOBILE ZONING
Mobile information technology has upended US land use regulation, and the ramifications of this technological upheaval are finally coming into view.
Robert Seldin | Madison Highland Live Work Lofts
GET SMART
As buildings become increasingly technologized, especially after the pandemic, cyber-attacks can put entire properties at risk and require a firmwide security approach.
Noëlle Brisson and Michael Savoie | CyberReady, LLC
HEDGE TRIMMING
The rapid rise in consumer prices has rekindled the old debate about whether commercial real estate provides a long-term hedge against inflation (hint: look at multifamily).
Gleb Nechayev, CRE | Berkshire Residential Investments
THE NEW SCIENCE
While the real estate industry has long understood the need for data, it still struggles with connecting information to decision making. New strides in data science could change that.
Brian Biggs and Ashton Sein | Grosvenor
BRACE FOR IMPACT
The practice and expectations of investing across all industries is undergoing major upheaval and the key to stability will mean looking beyond profit for profit’s sake.
Michael Cooper and Richard Florida | Dream Unlimited Corporation
TRANSITION PLANS
Forecasts about the future of the office sector are often wildly conflicting, but the looming high tide of generational leadership transitions could change the script.
Sabrina Unger and Britteni Lupe | American Realty Advisors
WHAT DRIVES LOGISTICS?
The logistics sector was the winner of the pandemic recession—but is its rise built to last?
Hugues Braconnier and Dr. Megan Walters | Allianz Real Estate
RENEWED PURPOSE
From retail to office to abandoned factories and warehouses, owners of real estate are rethinking—and reinventing—the future of their investments.
John Thomas and Stacey Krumin | Squire Patton Boggs
DATABASICS
Data centers have become an increasingly institutionalized property class over the past several years, but finding success in the sector depends on talent and expertise.
Max Shepherd, Jannah Babasa, and Isabel Ruiz Halter | Sheffield Haworth
COOPERATIVE INVESTMENT
As insurance costs of residential and commercial spiral out of control, a 1400-year-old tradition is poised to offer long-term, sustainable growth for real estate investments.
Ishmam Ahmed | Georgetown University & AFIRE
DOMESTIC MIGRATION TRENDS
Dive into the report to understand if and how COVID impacted domestic migration patterns on a state, city, and zip code level.
Ethan Chernofsky | Placer.ai
UP FRONT
How does the Consumer Price Index account for the cost of housing?
David Wessel and Sophia Campbell | The Brookings Institution
THIS ISSUE OF SUMMIT JOURNAL IS PROUDLY SUPPORTED BY


Aegon Asset Management is an active global investor that manages and advises on assets of $328 billion* for global pension plans, public funds, insurance companies, banks, wealth managers, family offices, and foundations. Aegon AM’s Real Assets platform focuses on delivering yield-oriented and total return solutions spanning the risk/return spectrum.
With an over 35-year history and $25 billion* in AUM/AUA, the Real Assets business is built on a cycle-tested platform, deep and broad market access, and long-term relationships.
Our real assets debt and equity strategies seek to deliver strong relative value and returns through a research-intensive process. The process encompasses thoughtful top-down research and intelligent bottom-up analysis deployed by an experienced multidisciplined team of over 110 investment professionals.*
Each capability is underpinned by dedicated, in-house support and service teams including applied research, engineering and environmental, valuation, accounting, client service, legal and risk management.
*As of June 30, 2022. The assets under management/advisement described herein incorporates the entities within Aegon Asset Management brand as well as the following affiliates: Aegon Asset Management Holding B.V., Aegon Asset Management Spain, and joint-venture participations in Aegon Industrial Fund Management Co. LTD, La Banque Postale Asset Management SA, and Pelargos Capital BV.