
While the market rarely sends clear investing signals, current market conditions are replete with clues, but as timing for corrections is difficult, a move to risk-off strategies could be useful.
It is understandable that some real estate investors find this juxtaposition a bit bewildering. And, for most investors and fund managers, it is impractical to move to cash while awaiting a resolution of these mixed signals. Moreover, even if some investors feel that a market correction is imminent, it is incredibly difficult to time such corrections. What should thoughtful real estate investors do? Move to risk-off strategies.
CURRENT PRICING
The long-term view of current capitalization rates, for US-based-core properties, suggests that they have never been this low.
In Exhibit 1, the path of the blue line, indexed to the left-hand vertical axis, represents the value of $100 invested in the NCREIF Property Index (NPI) at its inception in 1978. While the scale somewhat obscures valuation changes in the early years of the Index, at least two significant price reversals are seen: (1) in the late 1980s and early 1990s, when Index values fell by 25–30%, and (2) in the mid 2000s, when Index values fell by 35–40%. (If you like, you can add a third: the fairly minor impact1 of the COVID pandemic is observed in the early 2020s.)
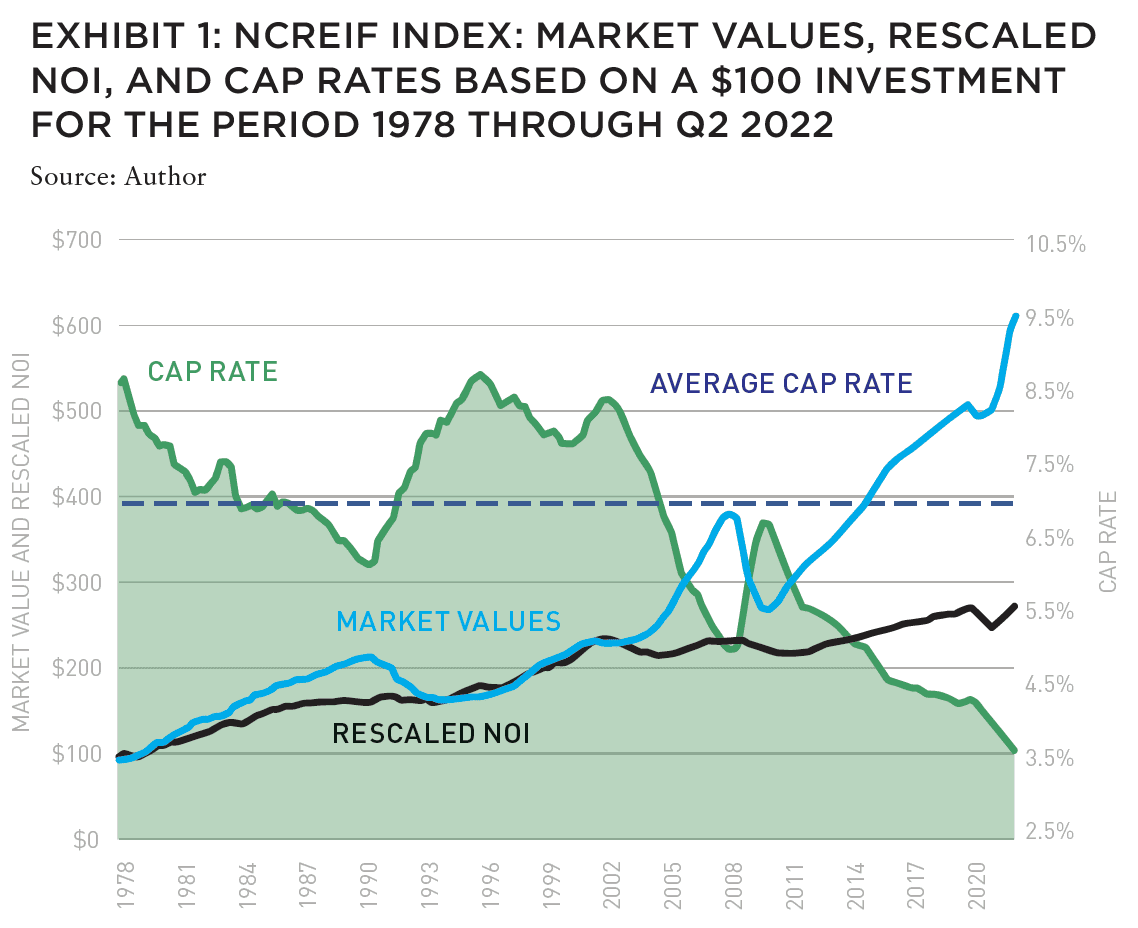
Broadly speaking, the NPI is characterized by high-quality (i.e., institutionally owned) properties. So, the “flight to quality” that occurs in most downturns (real estate or otherwise) is not observed in these data. While reliable data on lower-quality assets—those often found in non-core funds, often referred to as “transitional” properties—are difficult to come by, it is generally believed that lower-quality properties fell even further during the market corrections in the late 1980s and early 1990s, and in the mid 2000s.
Similarly, the red line in Exhibit 1 indicates the growth in (restated) net operating income assuming US$100 of income2 in 1978 over the same period (it is also indexed to the left-hand vertical axis). Given a time series of property values and income levels, a time series of capitalization rates is constructed; these rates are shown by the top line of the green-shaded region (and are indexed to the right-hand vertical axis). The green dashed line indicates that capitalization rates have averaged approximately 6.7% over this nearly 45-year period. In general, the time-series path of capitalization rates has been downward sloping. Possible explanations include a generally declining path of interest rates and the growing acceptance of commercial real estate as an institutional asset class.
ANGST ABOUT PRICING
Not surprisingly, this group of 111 global respondents—each representing the point of view of their respective organizations—listed inflation, geopolitics, war, and interest rates as their greatest investment threats. But at the same time, they are also able to extract opportunity from these seemingly unprecedented challenges.
Whatever the reasons for the downward trend, cap rates cannot endlessly decline—there needs to be some bottom, if not a rebound. And to that end, the current pricing of US commercial real estate ought to give investors pause. For example, today’s prices for core properties in the primary markets are more than 50% higher than before the Global Financial Crisis (GFC), and today’s cap rates, approximately 3.8%, are the lowest in the NCREIF history.
While discussions about and definitions of “bubbles” are fraught with imprecision, Greenspan—reflecting on the GFC—indicated what he thought the signs of a bubble to be [emphasis added]:3
. . . I define a bubble as a protracted period of falling risk aversion that translates into falling capitalization rates that decline measurably below their long-term, trendless averages. Falling capitalization rates propel one or more asset prices to unsustainable levels. All bubbles burst when risk aversion reaches its irreducible minimum, i.e., credit spreads approach zero, though analysts’ ability to time the onset of deflation has proved elusive.
If we take Greenspan’s definition to the NCREIF data, we see that today’s capitalization rates are nearly 340 BPS lower than their long-term average:
Cap Rate Comparison
Current Cap Rate: 3.68%
Long-Term (Trendless Average): 7.05%
Difference: 3.37%
This difference represents the greatest disparity between the current capitalization rate and the then-current long-term trendless average of prior capitalization rates in the NPI history.
RISK-ON/RISK-OFF INVESTING
Since we are in the real estate investment business, most of us can’t “go to cash” and wait for a price correction. It may never come. Instead, shrewd investors often employ a “risk on/risk off” approach to investing. Following an event such as the GFC, when investors’ risk aversion is quite high, the smart money invests aggressively (i.e., “risk on”). However, as memories of the adverse event fade and risk aversion diminishes dramatically, the smart money invests conservatively (i.e., “risk off”). In the latter period, investors aren’t paid much for taking risk; moreover, and assuming the adverse financial event arrives, the low-quality assets are most-harshly valued downward (i.e., there’s a “flight to quality” in the downturn).
Perhaps Warren Buffett best summarized this approach: “We simply attempt to be fearful when others are greedy and to be greedy only when others are fearful.“4
While the signs for such market extremes are imprecise, investors often look to telltale signs in both the credit markets (such as credit spreads, available leverage ratios, severity of loan covenants, etc.) and the equity markets (such as cap rates vs. risk-free rates, ease of fund-raising, the amount of “dry powder,” governance provisions in fund and/or joint venture documents, etc.), the strategy can be generally described with what we see in Exhibit 2:
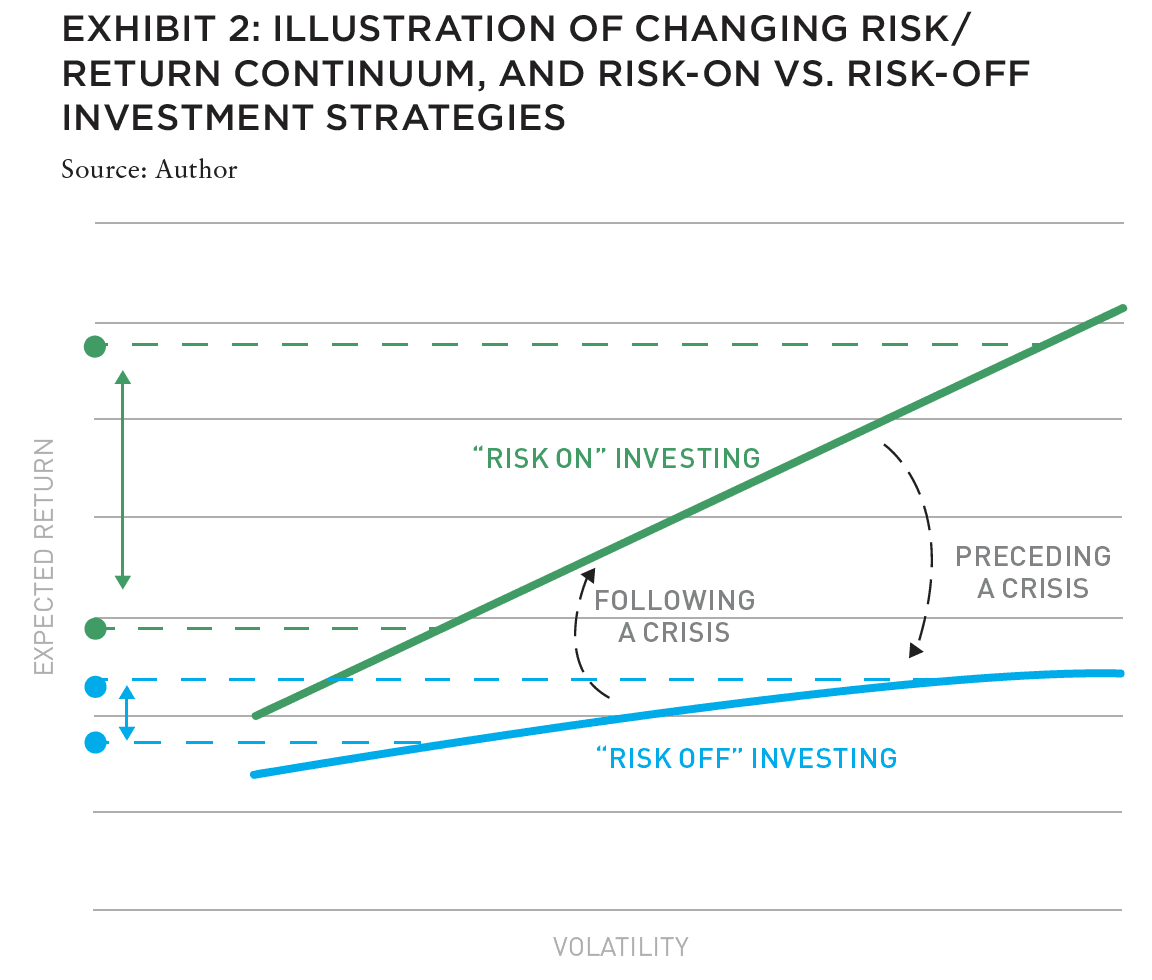
Thus, risk-on/risk-off investing is intended to tactically respond to current market conditions. Following some sort of market correction (e.g., the GFC), the risk-return continuum is typically elevated and steeply sloped. However, as the market’s collective reaction to that correction wanes (e.g., more than a decade has passed), the continuum sinks and is shallowly sloped. In the former state, the expected to rewards to risk-taking are significant; in the latter state, the expected to rewards to risk-taking approach insignificant.
That said, de-risking depends on each real estate investor and fund manager. Very few investors have broad discretion. Most investors—and certainly operators and fund managers—have discretion within the confines of a given strategy. As one example, the core real estate manager5 might avoid the “style drift” (in this case, a tendency to move towards core-plus and/or value-added strategies) often found in “late cycle” investing, and instead concentrate on best-in-class assets. Such a rebalancing avoids the dilutive effects of the promoted interests paid to operating partners and the increased drag of transaction costs that typically accompany the short-term nature of non-core investments.6 Furthermore, investors and fund managers may—where possible— consider lowering the leverage ratio of their investments, thereby reducing the chances of financial distress often associated with significant market downturns. Similar arguments could be made on behalf of non-core managers and strategies.
WHEN THE INCREASE IN RISK DWARFS THE INCREASE IN RETURN
In today’s low-return environment, some investors have moved their real estate portfolio allocations further out on the risk/return continuum, arguing that low-risk strategies provide insufficient rewards. And while it is true that moving further out on the risk/ return continuum increases the investor’s expected return, it does so at the increasing risk of a significant shortfall with regard to the investor’s liability management.7 To illustrate this proposition, consider Exhibits 3 and 4:
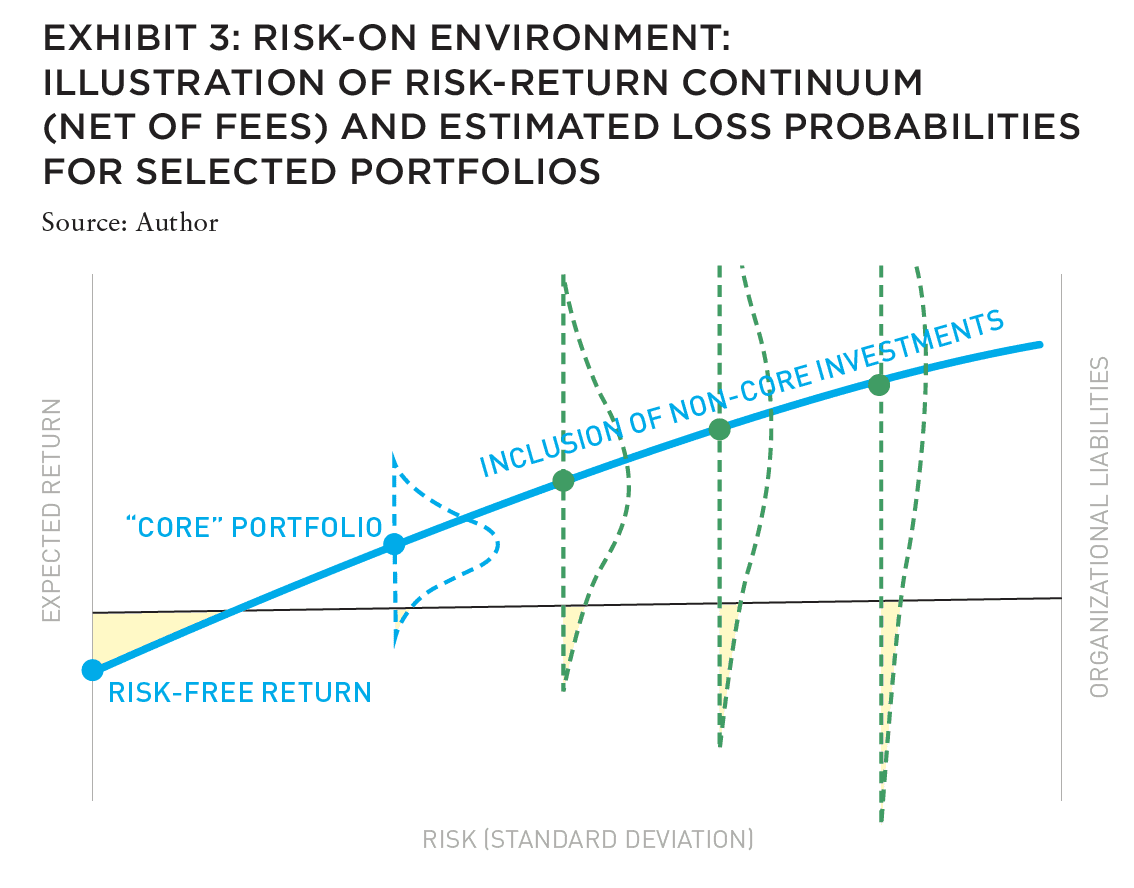
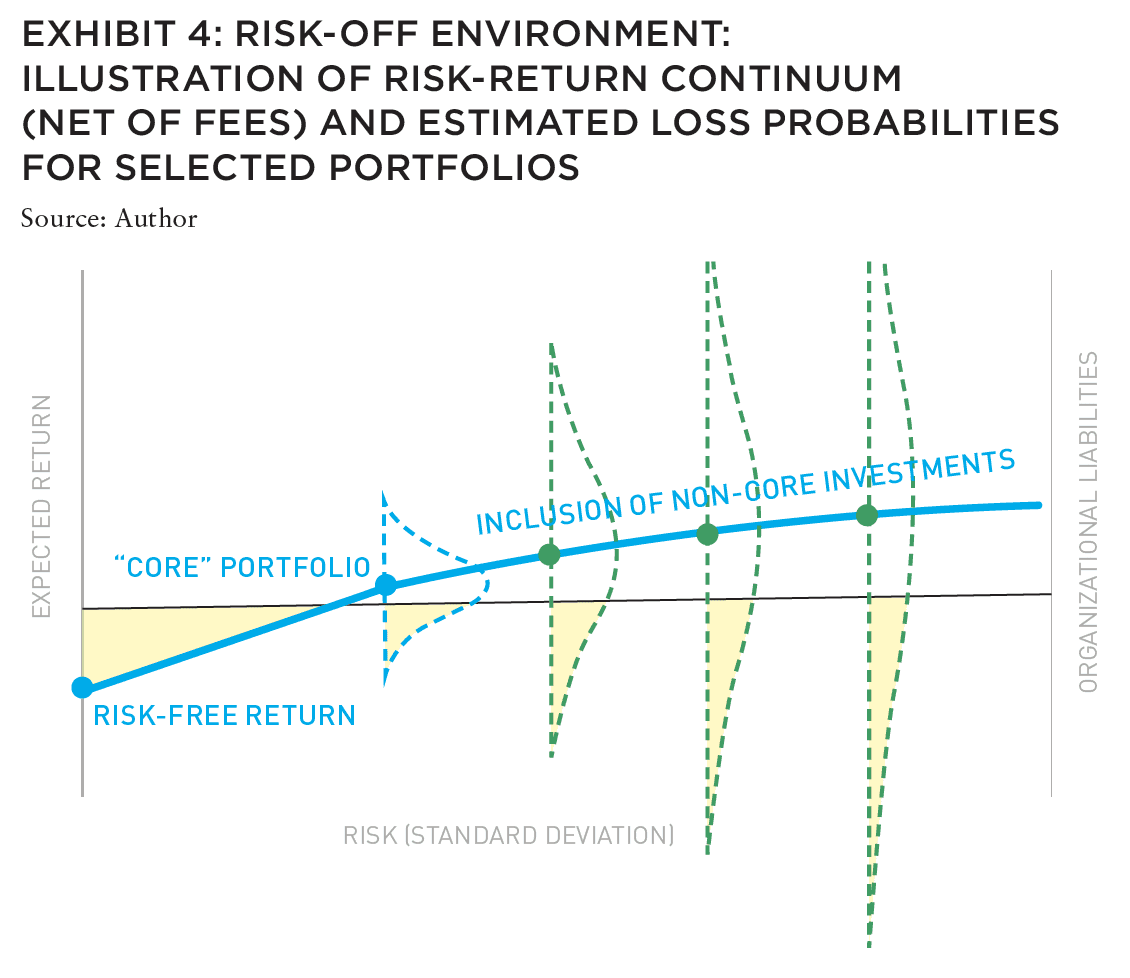
The first of these two exhibits is meant to convey the general sense of a risk-on market, in which the chances of the realizing a return below the investor’s liabilities or a given threshold are fairly small in comparison to the second of these two illustrations. Exhibit 4 is meant to convey the cost of “reaching for yield” (or, equivalently, “swinging for the fences”) in a low-return/risk-off world; such behavior significantly increases the risk of realizing a shortfall with respect to the organization’s liabilities.
This cost is compounded by the likelihood that a real estate market correction–should it come to pass–will coincide with a similar correction in the broader capital markets, perhaps abetted by bouts of “distress” and illiquidity; all of which greatly worsens the downside of being overly invested in risky assets during a market reversal.
Joe Pagliari’s article is a worthwhile read. His writing reflects a special mix of academic rigor and inside baseball from his days at an investment advisor.
He’s right about the complexity of the current macro backdrop, with strong job creation occurring even as we face the possibility of a second consecutive quarter of negative GDP. Within real estate, change is already occurring as rate hikes to quell inflation mean that the cost of debt now exceeds the ultra-low capitalization rates on which assets were trading. Initially, cap rates were moving up for lesser-quality assets in lesser locations but now, cap rates are rising more widely, if not across the board.
I share Joe’s view that this is a good time to seek risk-off strategies, including investment in retail, where leverage is still accretive. Despite store openings exceeding store closings, retail remains out of favor, hence its high initial yield. Asset selection is key, but opportunities exist. Similarly, add to the mix sectors with defensive characteristics like storage and student housing. Both have short lease terms— positioning them as inflation hedges—and tenant demand that tends to hold up even as economic growth slows.
ABOUT THE AUTHOR
Joseph L. Pagliari Jr., Ph.D., CFA, CPA, is Clinical Professor of Real Estate at the University of Chicago Booth School of Business and focuses his research and teaching efforts on issues broadly surrounding institutional real estate investment.
—
EXPLORE THE LATEST ISSUE

CAPITAL MARKETS PULSE
Through the rest of this year, investors forecast challenges for global capital, but thoughtful investors are forging ahead.
Gunnar Branson and Benjamin van Loon | AFIRE
ON/OFF SWITCH
While the market rarely sends clear investing signals, current market conditions are replete with clues, but as timing for corrections is difficult, a move to risk-off strategies could be useful.
Joseph L. Pagliari | University of Chicago
MOBILE ZONING
Mobile information technology has upended US land use regulation, and the ramifications of this technological upheaval are finally coming into view.
Robert Seldin | Madison Highland Live Work Lofts
GET SMART
As buildings become increasingly technologized, especially after the pandemic, cyber-attacks can put entire properties at risk and require a firmwide security approach.
Noëlle Brisson and Michael Savoie | CyberReady, LLC
HEDGE TRIMMING
The rapid rise in consumer prices has rekindled the old debate about whether commercial real estate provides a long-term hedge against inflation (hint: look at multifamily).
Gleb Nechayev, CRE | Berkshire Residential Investments
THE NEW SCIENCE
While the real estate industry has long understood the need for data, it still struggles with connecting information to decision making. New strides in data science could change that.
Brian Biggs and Ashton Sein | Grosvenor
BRACE FOR IMPACT
The practice and expectations of investing across all industries is undergoing major upheaval and the key to stability will mean looking beyond profit for profit’s sake.
Michael Cooper and Richard Florida | Dream Unlimited Corporation
TRANSITION PLANS
Forecasts about the future of the office sector are often wildly conflicting, but the looming high tide of generational leadership transitions could change the script.
Sabrina Unger and Britteni Lupe | American Realty Advisors
WHAT DRIVES LOGISTICS?
The logistics sector was the winner of the pandemic recession—but is its rise built to last?
Hugues Braconnier and Dr. Megan Walters | Allianz Real Estate
RENEWED PURPOSE
From retail to office to abandoned factories and warehouses, owners of real estate are rethinking—and reinventing—the future of their investments.
John Thomas and Stacey Krumin | Squire Patton Boggs
DATABASICS
Data centers have become an increasingly institutionalized property class over the past several years, but finding success in the sector depends on talent and expertise.
Max Shepherd, Jannah Babasa, and Isabel Ruiz Halter | Sheffield Haworth
COOPERATIVE INVESTMENT
As insurance costs of residential and commercial spiral out of control, a 1400-year-old tradition is poised to offer long-term, sustainable growth for real estate investments.
Ishmam Ahmed | Georgetown University & AFIRE
DOMESTIC MIGRATION TRENDS
Dive into the report to understand if and how COVID impacted domestic migration patterns on a state, city, and zip code level.
Ethan Chernofsky | Placer.ai
UP FRONT
How does the Consumer Price Index account for the cost of housing?
David Wessel and Sophia Campbell | The Brookings Institution
NOTES
1 While not the main point here, the minor dip of ≈ 1.7% in NPI valuations may be understated, attributable to “appraisal smoothing.” As a counter example, it is estimated that asset values in the public REIT market fell by ≈ 6.7%, while asset values for those public REITs investing in the core property types fell by ≈ 10.9%. (Moreover, Green Street’s Commercial Property Price Index estimates, as of Q2 2022, a near 5% decline in their all-property index—whereas NCREIF shows no such retreat.) See: “REITs Amid a Pandemic,” Green Street, accessed February 1, 2022; greenstreet.com.
2 While a $100 property investment does not produce $100 of income, both indices are initially set to $100 so as to improve the visual comparison of changes in property values to changes in income levels. Without restating the income levels, it would be difficult to visually discern the differences in changing income levels.
3 See: Alan Greenspan, “The Crisis,” Brookings Papers on Economic Activity, working paper, Spring 2010, p. 201–46; brookings.edu/bpea-articles/the-crisis
4 While Buffet’s remarks were aimed at clear market turns, the tactical application of his approach is also broadly applicable. See: Warren Buffet, “Chairman’s Letter,” BerkshireHathaway Annual Report, 1986, accessed August 11, 2022; berkshirehathaway.com/letters/1986.html.
5 See: Joseph Pagliari, “High-Yield Lending’s Characteristics as a Function of Asset-Level Volatility,” CRE Finance Council, April 2022; faculty.chicagobooth.edu/-/media/faculty/joseph-pagliari/docs/mezzscharacteristicfassetcharacterisitics13022.pdf.
6 See: Mitchell Bollinger and Joseph Pagliari,” Another Look at Private Real Estate Returns by Strategy,” Journal of Portfolio Management 45, 2019; doi.org/10.3905/jpm.2019.1.098
7 The nature of the liabilities depends on the investor’s circumstances. For example, a defined-benefit pension plan has to fund future payments to the plan’s beneficiaries, a university endowment plan aims to produce a certain minimum spending rate, a household would like to finance a comfortable retirement and so on.
THIS ISSUE OF SUMMIT JOURNAL IS PROUDLY SUPPORTED BY


Aegon Asset Management is an active global investor that manages and advises on assets of $328 billion* for global pension plans, public funds, insurance companies, banks, wealth managers, family offices, and foundations. Aegon AM’s Real Assets platform focuses on delivering yield-oriented and total return solutions spanning the risk/return spectrum.
With an over 35-year history and $25 billion* in AUM/AUA, the Real Assets business is built on a cycle-tested platform, deep and broad market access, and long-term relationships.
Our real assets debt and equity strategies seek to deliver strong relative value and returns through a research-intensive process. The process encompasses thoughtful top-down research and intelligent bottom-up analysis deployed by an experienced multidisciplined team of over 110 investment professionals.*
Each capability is underpinned by dedicated, in-house support and service teams including applied research, engineering and environmental, valuation, accounting, client service, legal and risk management.
*As of June 30, 2022. The assets under management/advisement described herein incorporates the entities within Aegon Asset Management brand as well as the following affiliates: Aegon Asset Management Holding B.V., Aegon Asset Management Spain, and joint-venture participations in Aegon Industrial Fund Management Co. LTD, La Banque Postale Asset Management SA, and Pelargos Capital BV.