
Although there used to be a logical inverse relationship between the change in office-using jobs and office vacancy rates, that relationship broke down in the wake of COVID.
When it comes to office usage, in place of citing the examples of incongruity or incongruous put forth by the Merriam Webster dictionary, we will give our own example: Incongruity has manifested when there is a positive change in office-using jobs over a given time period, accompanied by an increase in office vacancy and a simultaneous decrease in office inventory per office-using job.
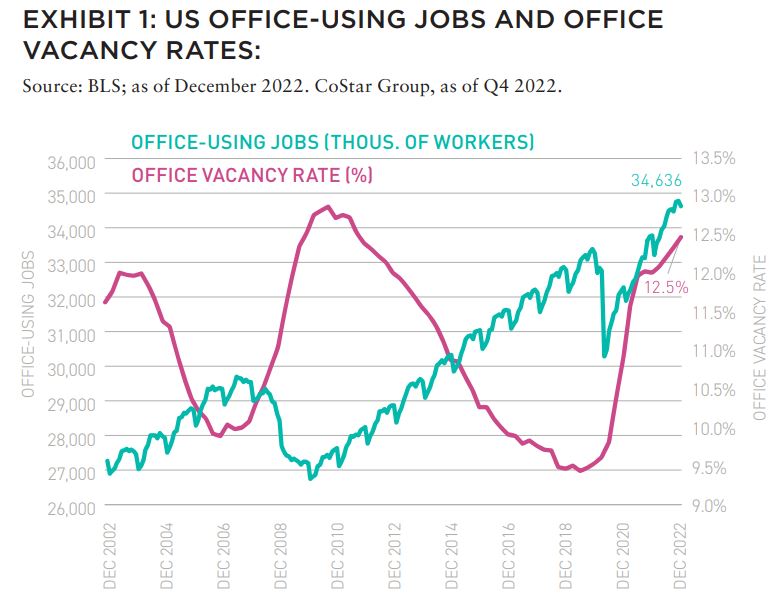
Although in the past there was the logical inverse relationship between the change in office-using jobs (OUJ) and change in office vacancy rates, that relationship broke down in the wake of COVID lockdowns.
The number OUJs increased from 32,743,000 as of March 2020 to 34,636,000 as of December 2022; a 12.8% increase in 33 months’ time. Historically, that has signaled greater office demand and a lower vacancy rate. But not this time.
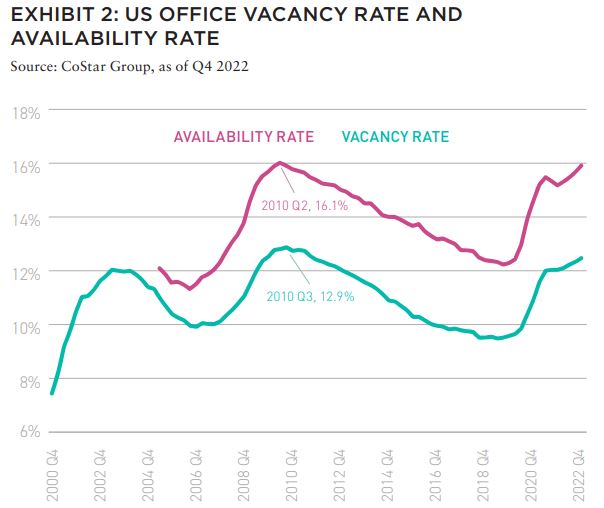
The office vacancy rate increased from 9.6% as of Q1 2020 to 12.5% by the end of Q4 2022, according to CoStar data. A starker manifestation of this trend was in the availability rate (includes space for sublease) which increased from 12.4% to 16% during the same period. Office leasing volume, including new leases and renewals, for full year 2022, was 71% of the pre-COVID 2019 average. Additions to inventory did not account for the higher vacancy rate. According to CoStar data, office inventory per office-using job decreased by 3.3% during roughly the same time.
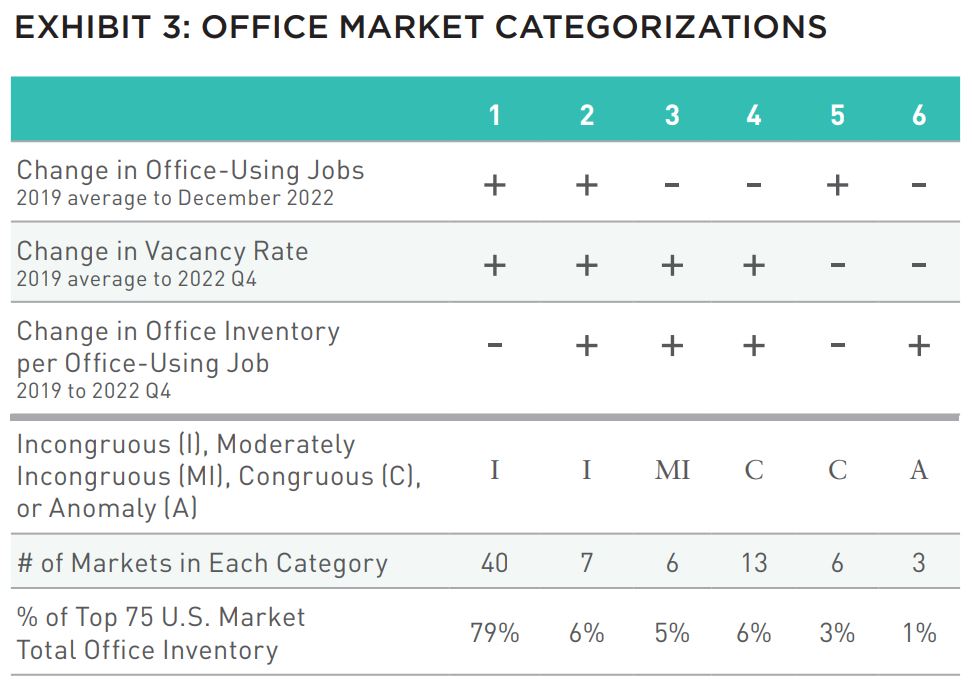
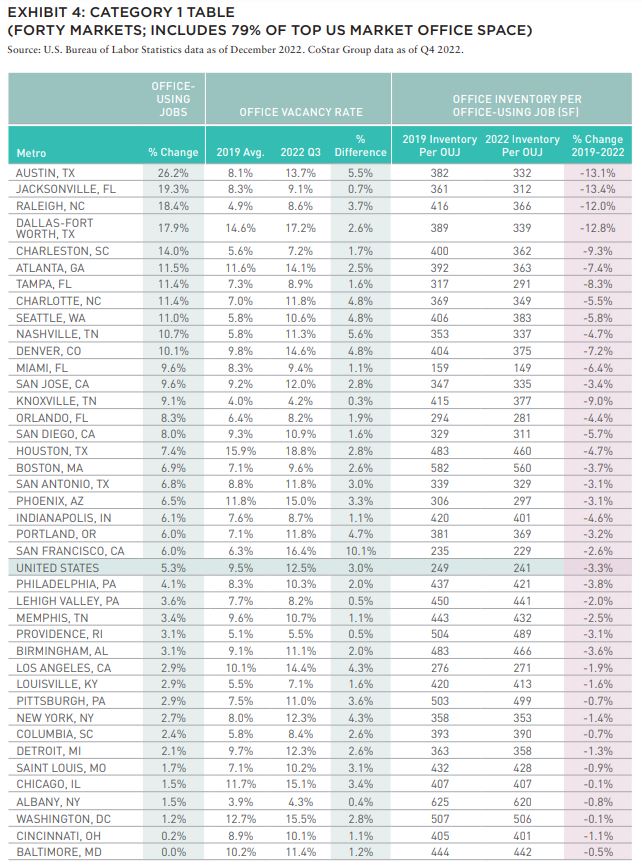
The numbers become more interesting when analyzed on the metro level. We have divided the top 75 metro areas into six categories and found the following: of the top 75 office markets analyzed by the Strategy and Research Group (SRG) of New York Life Real Estate Investors, forty office markets1, plus the US national average, meet the following conditions:
- Positive change in office-using jobs from 2019 average to December 2022
- Increase in office vacancy rates from 2019 average to Q4 2022
- Decrease in office inventory per office-using job from 2019 to 2022 Q4
As detailed in Exhibit 3, this group of forty office markets will be referred to as Category 1 and it constitutes 79% of total office space across the 75 largest US markets. Categories 2 and 3 represent a similar dynamic, and constitute another 6% and 5%, respectively. Combined, these three categories constitute 90% of total office space. The following table summarizes the findings in this report.
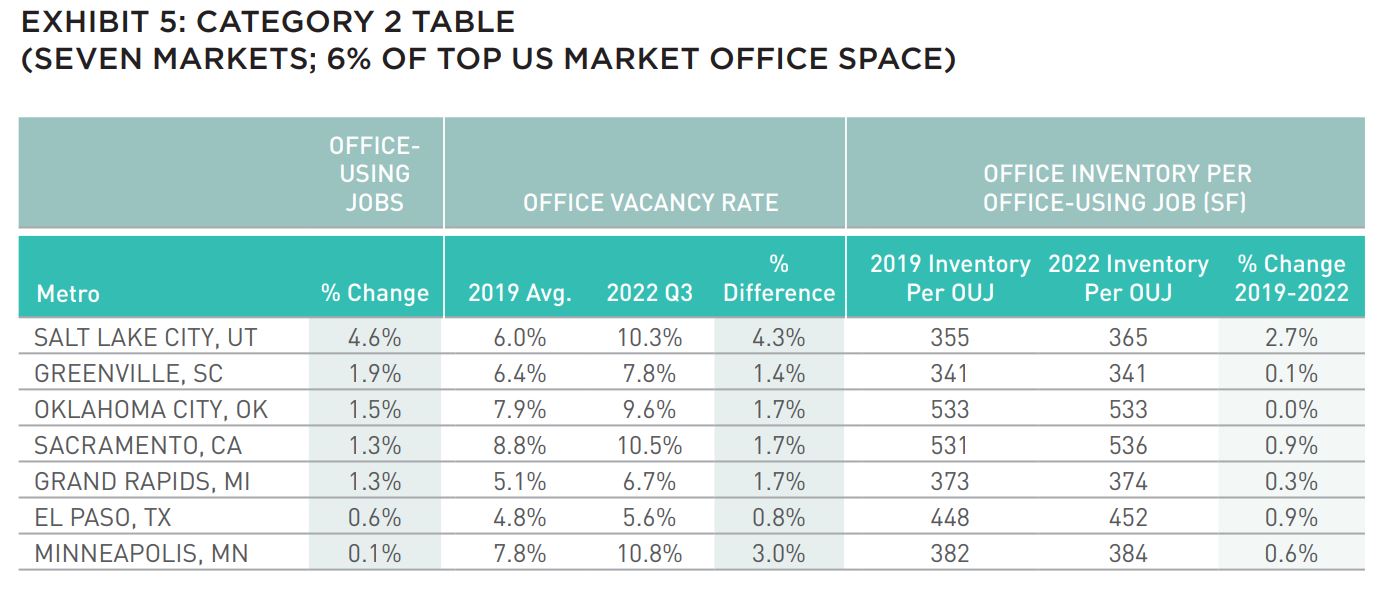
Another seven office markets2 meet the first two criteria…
- Positive change in officeusing jobs from 2019 average to December 2022
- Increase in office vacancy rates from 2019 average to 2022 Q4
- … but experienced an increase in office inventory per office-using job of less than 2.7%. Effectively, in these markets, vacancy rates remain elevated despite a nominal increase in office inventory.
Another seven office markets2 meet the first two criteria…
- Positive change in office-using jobs from 2019
average to December 2022 - Increase in office vacancy rates from 2019 average to 2022 Q4
- … but experienced an increase in office inventory per office-using job of less than 2.7%. Effectively, in these markets, vacancy rates remain elevated despite a nominal increase in office inventory
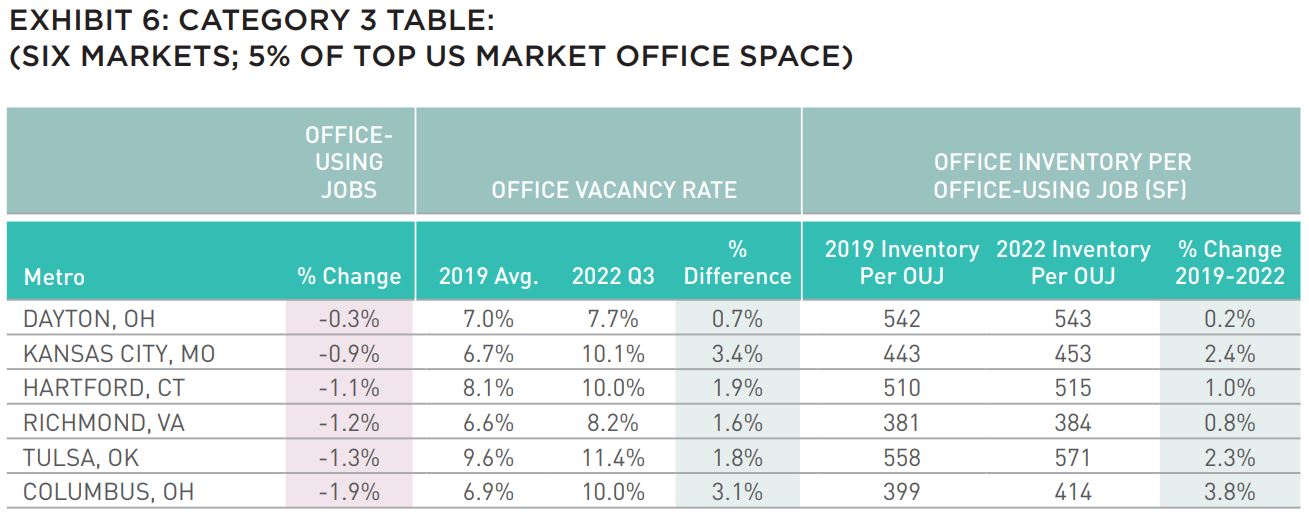
An additional six office markets3 meet the following criteria:
- Negative change in office-using jobs
- Increase in office vacancy rates greater than the decline in office-using jobs
- Increase in office inventory per OUJ
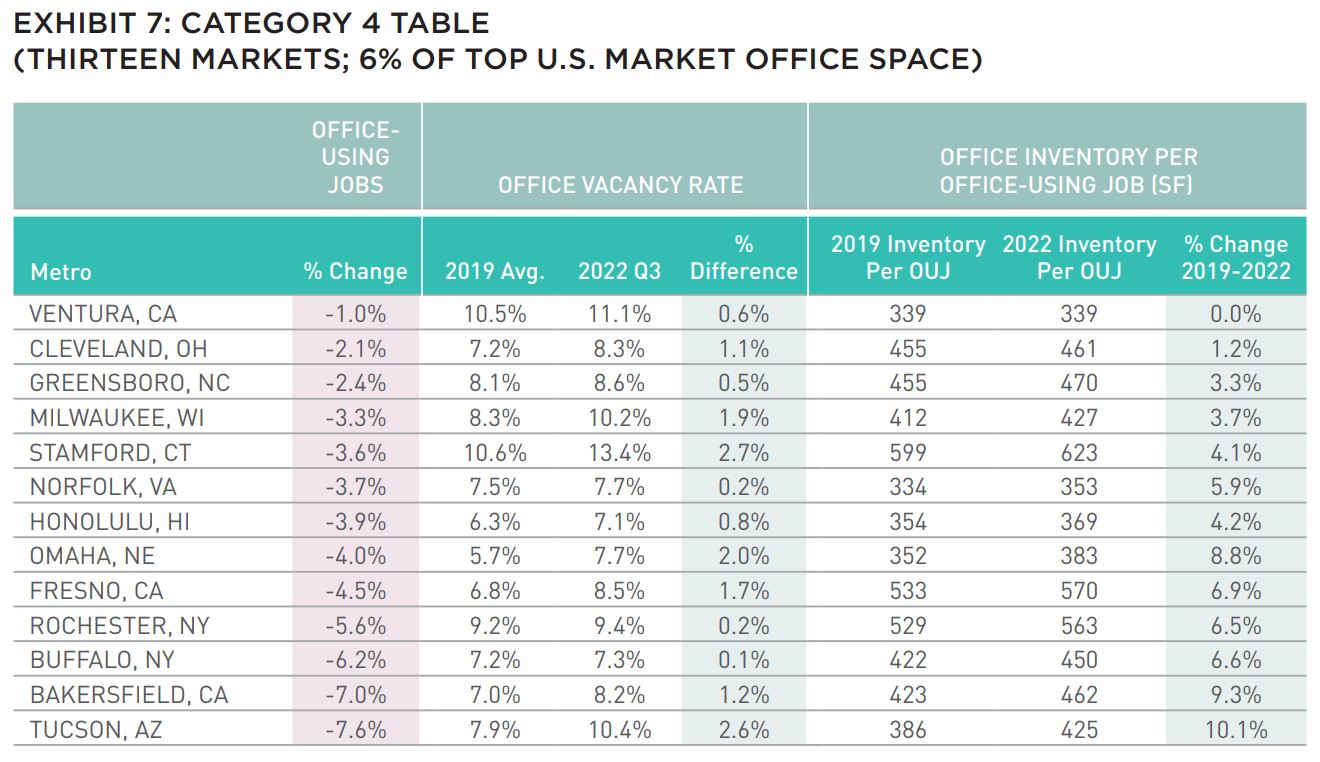
An additional number of office markets (currently 13 markets)4 performed in a generally expected manner and meet the following criteria:
- Negative change in office using jobs
- Increase in office vacancy rates less than the decline in office-using jobs
- Increase in office inventory per office-using job
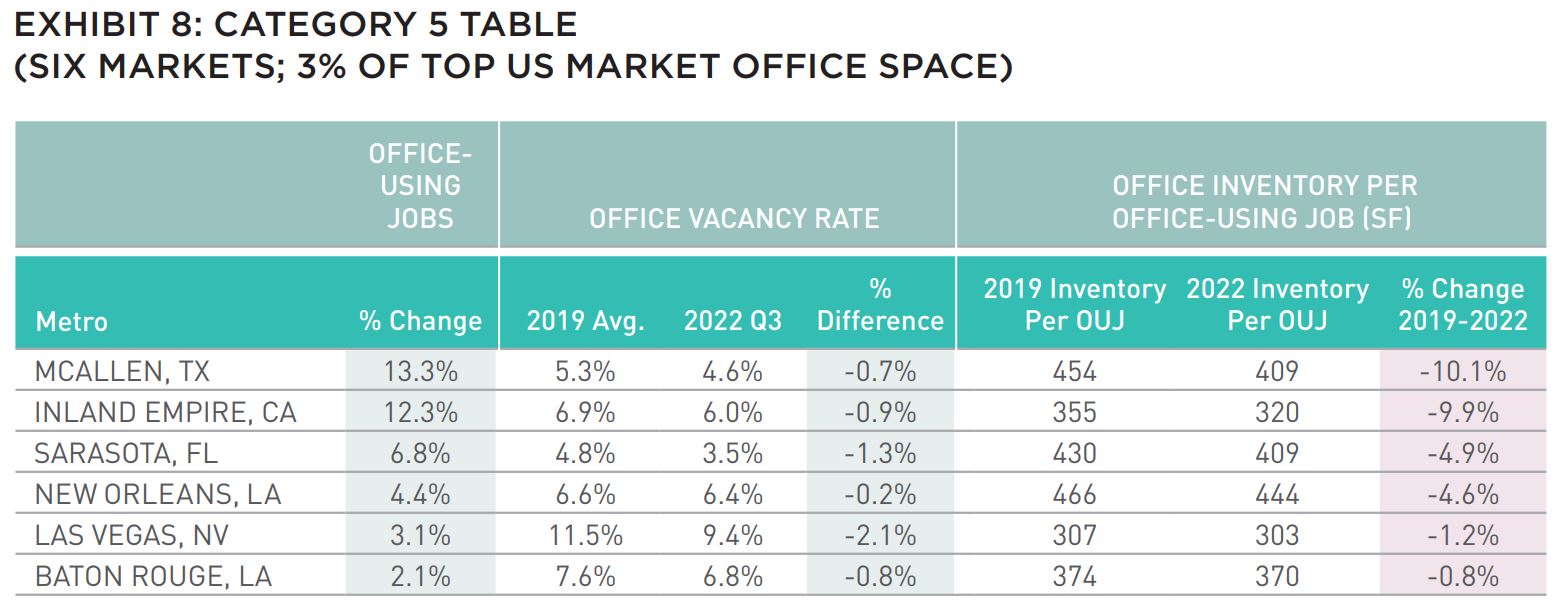
An additional relatively small office markets (currently 6 markets)5 performed in the expected manner and meet the following criteria:
- Positive change in office-using jobs
- Decrease in office vacancy rates
- Decrease in office inventory per office-using job
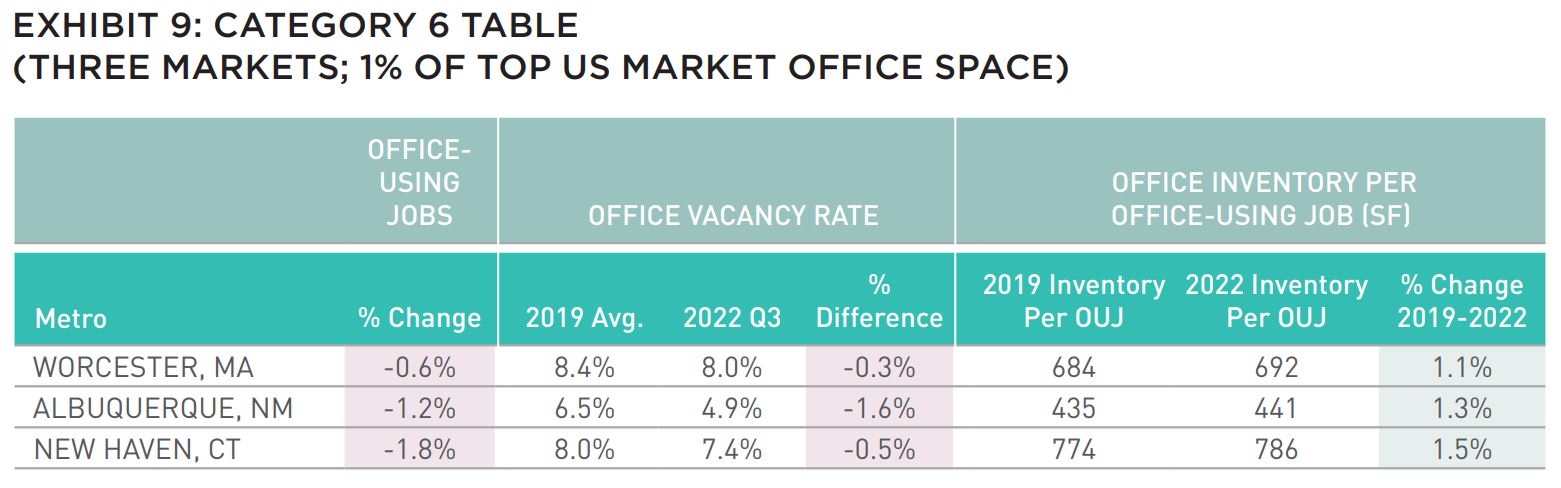
The remaining relatively small office markets (currently three markets)6 performed in the expected manner and meet the following criteria:
- Negative change in office-using jobs
- Decrease in office vacancy rates
- Increase in office inventory per office-using job
CATEGORY 1 MARKETS ACCOUNT FOR 79% OF US OFFICE INVENTORY
Categories 1–3 represent 53 of the 75 markets and constitute 90% of the presented US office inventory. Categories 1–4 are 66 of the 75 markets. Those 66 markets constitute 96% of the presented US office inventory. Markets that fall into category 5 are mostly small, less consequential office markets. The automobile commutes in most category 4 and 5 markets are relatively short and therefore commuting to the office is relatively easy. Accordingly, these markets are likely to have lower work-from-home rates and higher occupancy levels. Anomalies are more likely in small markets. That is the case with category 6 in which there was a negative change in office-using jobs, a decrease in office vacancy rates and an increase in office inventory per office-using job.
PRIMARY REASON FOR INCONGRUITY
Office-using jobs growth and occupancy decline incongruity manifested in metros representing 90% of US office inventory which includes categories 1– 3. These metros generally include the largest and most important office markets in the US.
So, what is the reason this historically reliable relationship, which had office vacancy declining when OUJ increased, broke down in the wake of the pandemic? Remote Work.
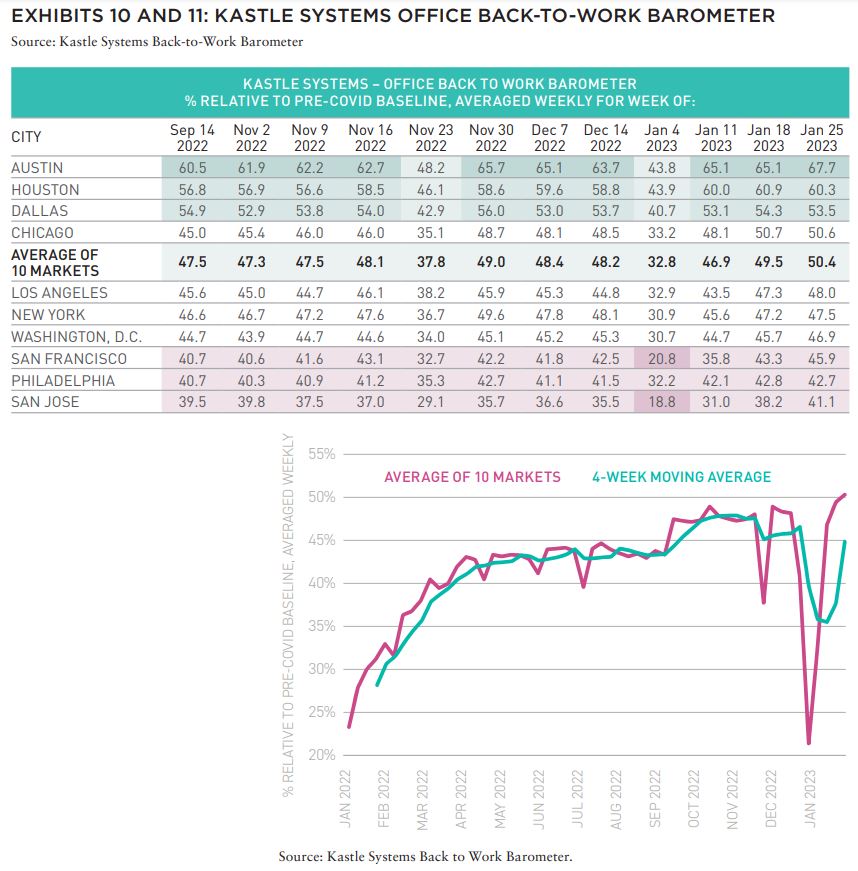
According to data from Kastle Systems, physical office occupancy is only 50.4% of pre-Covid levels.7 This number has barely improved from the 47.5% level recorded in September 2022. Many companies do not have the need to lease as much office space as in the past and others have gone fully remote.
The Kastle System data is supported by looking at public transportation ridership levels in New York, Washington, DC, Chicago, Boston, and San Francisco. The ridership data tracks well directionally with the data provided by Kastle Systems. Public transportation ridership data shows that the commuter rail systems in New York are outperforming those in other cities in terms of percentage of riders returning since the start of the pandemic.
The average weekday ridership of Metro North and the LIRR in November were 68% and 67% of the levels noted in November 2019, respectively.8 Ridership levels of the MBTA in Boston reached 60% for the same period.9 However, ridership levels in Washington D.C., Chicago, and San Francisco are not as positive. During November 2022, the ridership levels in these three cities averaged only 42% of their pre-pandemic levels, with San Francisco performing the worst at 34%.10
The resulting landscape has shifted and according to CoStar, there is more than 400 million square feet of “missing” demand for office space based on expected leasing activity had historical trends prevailed. In addition, office tenants are focused on high-quality, newly constructed space. The office market is not only challenged by remote work, but also from functional obsolescence in older class B buildings, environmental mandates, and higher interest rates.
THE TRUE IMPACT OF REMOTE WORK
The incongruity manifested in the positive change in office-using jobs, combined with the increase in office vacancy rates and the decrease in office inventory per office-using job is a glaring indicator of the impact of remote work on the office market.
Increased Remote Work appears to be a consequential secular change – but the full scope of the outcome is still not known, and the true magnitude may not be known for years. As elevated levels of Remote Work extends in to its fourth year, it appears clear—at the very least—that it will be difficult to reverse completely.
—
ABOUT THE AUTHORS
Stewart Rubin is Senior Director and Head of Strategy and Research, and Dakota Firenze is a Senior Associate, for New York Life Real Estate Investors, a division of NYL Investors LLC, a wholly-owned subsidiary of New York Life Insurance Company.
NOTES
1. In Q3 2022, forty-four of the top seventy-five markets fell into this category, while fortytwo markets qualified in Q2 2022, and in twenty-four markets in Q1 2022. Overall, more markets were classified as Category 1 than at the beginning, indicating the incongruity became starker in 2022.
2. In Q3 2022, four of the top seventy-five markets fell into this category, while six markets qualified in Q2 2022, and nine markets in Q1 2022.
3. In Q3 2022, six of the top seventy-five markets fell into this category, while six markets qualified in Q2 2022, and eleven markets in Q1 2022.
4. In Q3 2022, sixteen of the top seventy-five markets fell into this category, while fourteen markets qualified in Q2 2022, and twenty-five markets in Q1 2022.
5. In Q3 2022, five of the top seventy-five markets fell into this category, while six markets qualified in Q2 2022 and Q1 2022.
6. In the first three quarters of 2022, three of the top seventy-five markets fell into this category as well.
7. Data as of January 30, 2023. Kastle Systems data is collected by keycard, fob and KastlePresence app access data from the 2,600 buildings and 41,000 businesses that Kastle Systems secures across 47 states. The Barometer weekly report summarizes access control data among Kastle System’s business partners in ten major metro areas, not a national statistical sample. Charted percentages reflect unique authorized user entries in each market relative to a pre-COVID baseline, averaged weekly.
8. MTA. “COVID-19 Ridership Trends.” Metropolitan Transportation Authority, accessed May 2, 2023. https://new.mta.info/coronavirus/ridership.
9. MBTA. “Performance Dashboard: Ridership.” MBTA Back on Track, 1 Nov. 2022, https://mbtabackontrack.com/performance/#/detail/ridership/2022-11-01////all.
10. Washington Metropolitan Area Transit Authority. “November 2022 Ridership Snapshot.” WMATA Ridership Portal, accessed May 3, 2023, https://www.wmata. com/initiatives/ridership-portal/upload/November-2022-Ridership-Snapshot.pdf.; Chicago Transit Authority. “Ridership Reports.” TransitChicago.com, https://www.transitchicago.com/ridership/; San Francisco Bay Area Rapid Transit District. “Ridership Reports.” Bay Area Rapid Transit, https://www.bart.gov/about/reports/ridership.
—
EXLORE THE FULL ISSUE

ALSO IN THIS ISSUE
AFIRE INTERNATIONAL INVESTOR SURVEY: Q1 2023 PULSE REPORT
Gunnar Branson and Benjamin van Loon | AFIRE
VALUATION CHALLENGE: SOLVING THE CRISIS IN COMMERCIAL REAL ESTATE VALUATION
Matt Pomeroy, MAI and Jackie Bowie | Chatham Financial
CONVERSION CALCULATOR: LEGAL OR NOT, A DYNAMIC CITY WILL CONVERT UNUSED OFFICES
Jim Costello | MSCI Real Assets
UNDERWRITING ROADBLOCKS: CAN THE HOSPITALITY MODEL OF UNDERWRITING SAVE OFFICE VALUES?
Joshua Harris, PhD | Lakemont Group & Fordham University
VACANT SPACE: OFFICE-USING JOBS AND DEMAND INCONGRUITY
Stewart Rubin and Dakota Firenze | New York Life Real Estate Investors
HIKING TRAILS: SHOULD INVESTORS CONSIDER ALLOCATIONS TO FLOATING-RATE DEBT?
Dags Chen, CFA | Barings Real Estate
RECESSION PREPPING: HOW VULNERABLE ARE COMMERCIAL MORTGAGE INVESTMENTS
Martha Peyton, PhD | Aegon Asset Management
MEASURING GENTRIFICATION: USING DATA SCIENCE TO PREDICT THE IMPACTS OF GENTRIFICATION
Ron Bekkerman | Cherre + Donal Warde | Tenney 110 + Maxime C. Cohen | McGill University
THE FUTURE IS EUROPEAN: THEMES FROM THE OLD WORLD SHAPING US MARKETS
Brian Klinksiek | LaSalle Investment Management
CULTURE SHOCK: THE CHALLENGE AND IMPORTANCE OF TRANSLATING ESG ACROSS BORDERS
AFIRE ESG Committee
FINE TUNING: GLOBAL REACH AND LOCAL EXPERTISE CAN CREATE UNIFIED REAL ESTATE EXPERIENCES
Mark Zettl | JLL
ACCESSING SUCCES: EXPLORING DIVERSITY TRENDS IN REAL ESTATE TALENT
Zoe Huges | NAREIM
RESCUE CAPITAL: RESPONDING TO THE NEW REAL ESTATE REALITY
Andrew Weiner and Joshua M. R. Becker | Pillsbury
CONVEX CURVES: A REMINDER ON PRICE CONVEXIVITY AND CAP-RATE VOLATILITY
Joseph Pagliari, PhD, CFA, CPA | University of Chicago