
In the wake of the Great Financial Crisis, certain metros in the Sand States suffered disproportionally. It may not be as bad this time.
Perhaps one of the most famous opening lines of any novel ever written is: “All happy families are alike; each unhappy family is unhappy in its own way.” Leo Tolstoy’s rhetorical flourish with which he began his 1877 novel Anna Karenina emphasizes that there are many factors which can cause a negative outcome; that, although outwardly unhappy families may appear sad, the causes and the manifestation of the misery are disparate.
Likewise, recessions all appear harsh; but their causes and magnitude, and impact on individual sectors vary.
One of the primary causes of the Global Financial Crisis (GFC) of 2008–09 was the housing bust, which had a particularly negative impact on the boom economies of Phoenix, Las Vegas, Inland Empire1, Tampa, Miami and other markets in Florida, Arizona, Nevada, and California (the Sand States2). Conversely, the unique COVID-induced recession had a positive impact on housing values and on commercial real estate. The next recession may be different. It is possible that the impact on the economy, housing, and commercial real estate of certain markets will be similar in direction but not necessarily in magnitude due to changed employment concentrations.
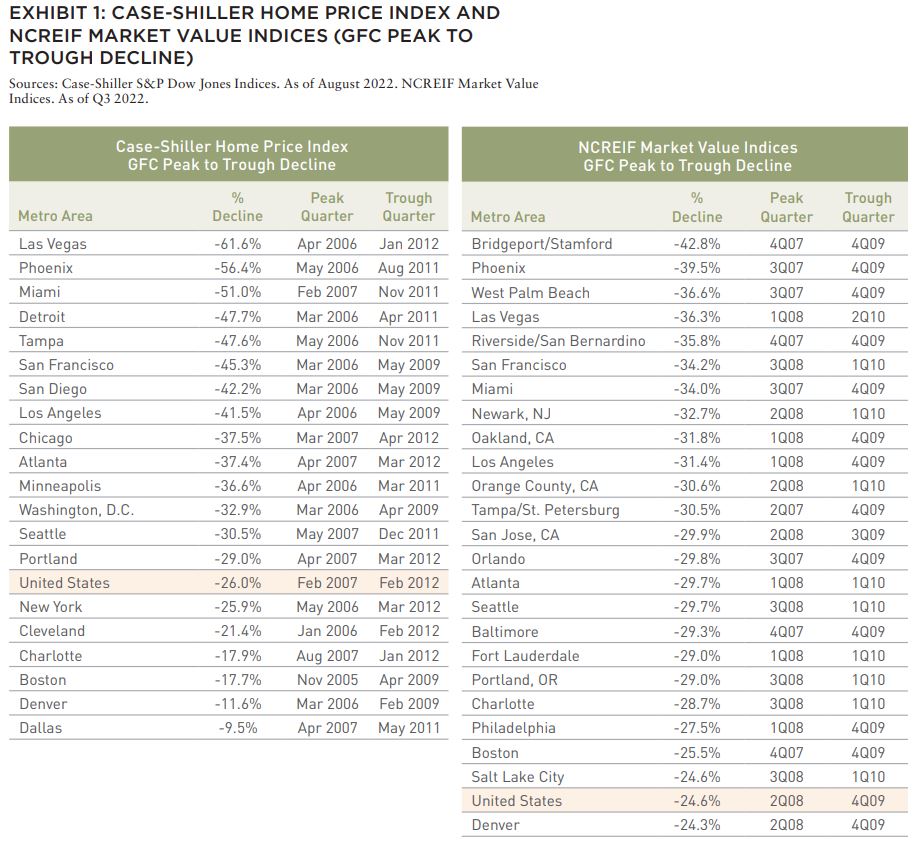
According to the Case-Shiller index of home prices, Las Vegas, Phoenix, Miami, and Tampa represented four of the five3 worst affected housing markets during the GFC. In terms of multifamily housing, Phoenix, Inland Empire, and Tampa represented three of the top five markets by value decline from peak to trough during the GFC.
In the case of both home prices and apartment valuations, these markets experienced peak to trough declines almost double the national average.
The GFC caused a bust in the booming economies of Phoenix, Las Vegas, Inland Empire, Tampa, and Miami, among others. These markets were hit particularly hard in the housing sector, both single family and multifamily.
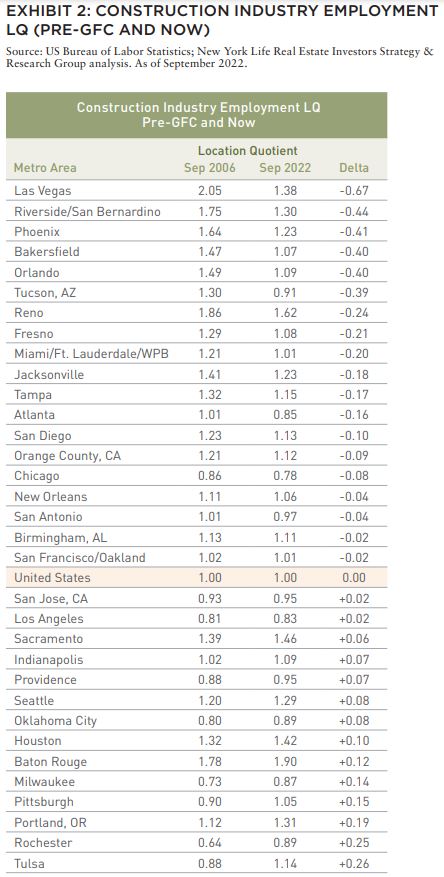
One key reason for this bust may be related to Sand State metro’s disproportionate reliance on construction jobs prior to the GFC. A concentration of construction jobs was particularly problematic during the GFC because of the industry’s inherent correlation with the housing market. Growing home values led to more homebuilding and demand for construction labor. When home values declined, so did demand for construction labor, which disproportionately impacted places with a greater share of construction jobs. As of September 2022, the construction industry makes up a smaller share of the employment base (Exhibit 2), where declines are noticeable in Las Vegas, Inland Empire, Phoenix, and other Sand State metros.
Since the GFC, the economies of these markets have become more diversified, particularly away from the construction sector, so the magnitude of a future setback or bust should be more muted. Therefore, the magnitude of the negative impact on the economic health, housing and commercial real estate values of their respective metros will likely be less than it was during the GFC.
In this analysis, we focus on the five large Sand State markets of Phoenix, Las Vegas, Inland Empire, Tampa, and Miami that suffered in the wake of the GFC and explore if the past is likely to be repeated based on certain factors that render these markets different than they have been in the past.
PHOENIX
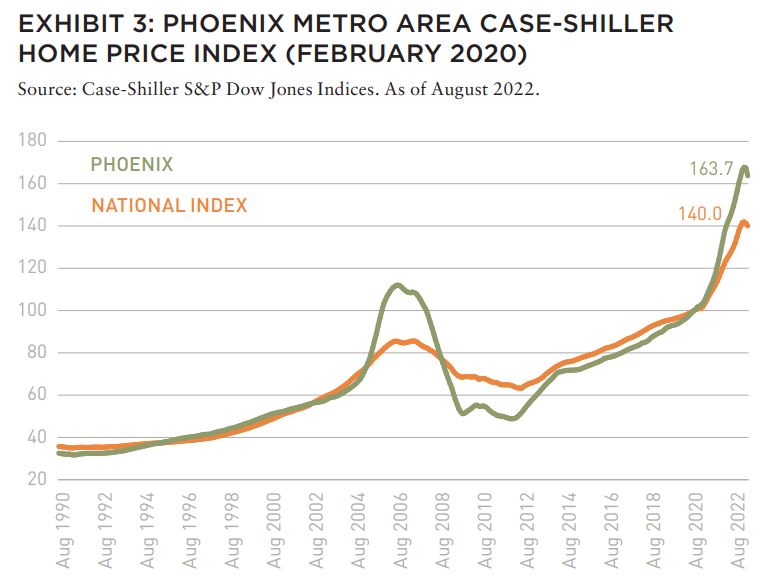
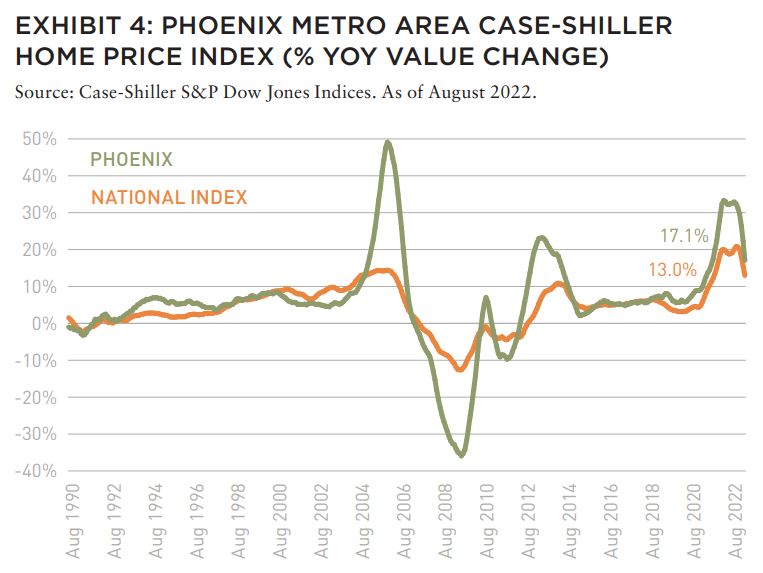
Phoenix was one of the epicenters of the housing crash that precipitated the GFC. In the three years prior to the peak, home values in Phoenix increased 89.6%, the highest among the twenty markets tracked by the Case-Shiller Index. In the wake of the GFC, Phoenix home values declined -56.4% from peak to trough; the second lowest behind Las Vegas. This compares to the US, where home values rose only 28.9% in the three years leading up to the national housing market peak in February 2007, and subsequently fell -26.0% from peak to trough.
In the run-up to the GFC, growth in home values in Phoenix reached a peak in September 2005, when home values increased +49.3% on a year-over-year basis. In the trough of the GFC, Phoenix home values reflected a decline of -36.0% year-over-year.
During the GFC, the value of institutional apartment properties in Phoenix experienced similar dynamics to home values. Phoenix apartment property values increased 31.3% year-over-year at its peak, before declining -33.0% year-over-year during the trough. By Q3 2022, Phoenix apartment values were up 27.6% year-over-year, which is nearly double the rate of the US.
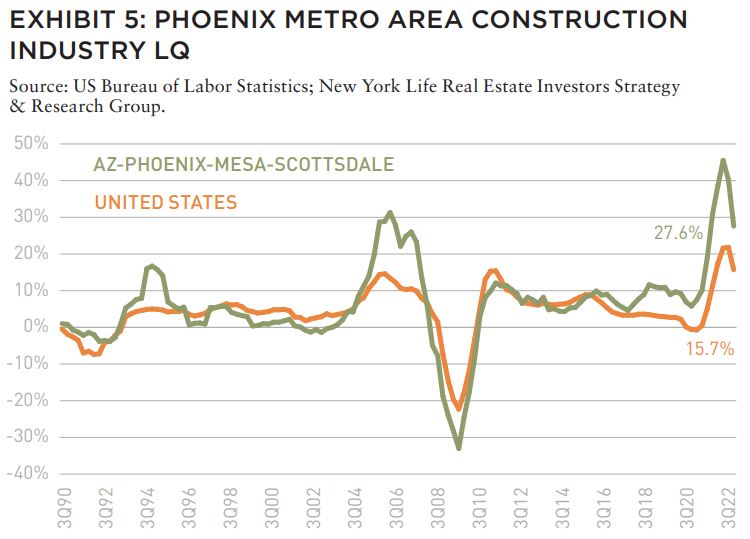

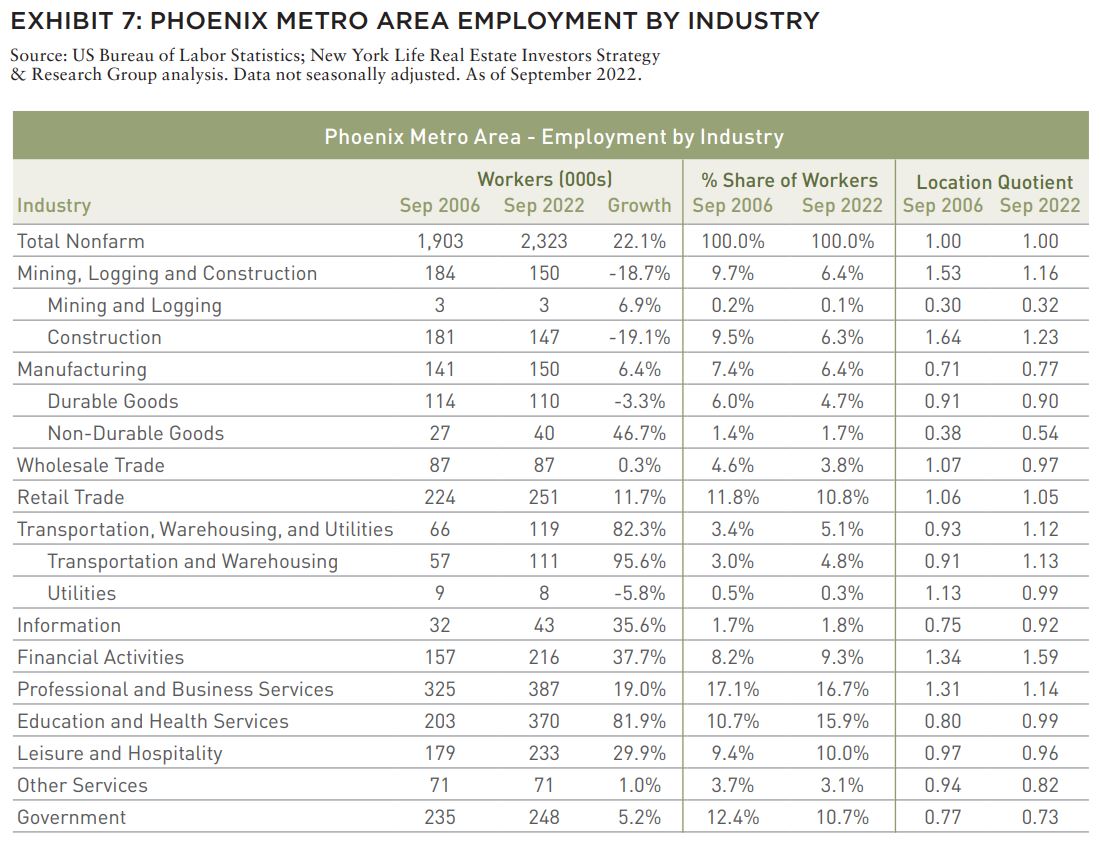
Are Phoenix housing and apartment prices likely to decline in a similar fashion during a possible 2022–23 recession? One indicator may be in comparing the concentration of construction jobs in 2006 and 2022. The LQ for the construction sector was 1.74 on the eve of the housing crisis (February 2006). However, as of September 2022 it had declined to 1.23. The Phoenix economy has diversified and is not as reliant on construction jobs and the housing industry as it was in the past. Phoenix was so reliant on the construction industry that nearly one out of every ten workers were employed in the construction sector.
The economy has since diversified and, as is true across the US, the transportation and warehousing (TW) sector has increased substantially. In Phoenix, the growth reflects a nearly 96% increase between 2006 and 2022. During that time, the Financial Activities LQ increased from 1.34 to 1.59. The economic downturn that Phoenix would likely experience during a recession would likely be of a lower order of magnitude than that which was experienced during the GFC.
LAS VEGAS
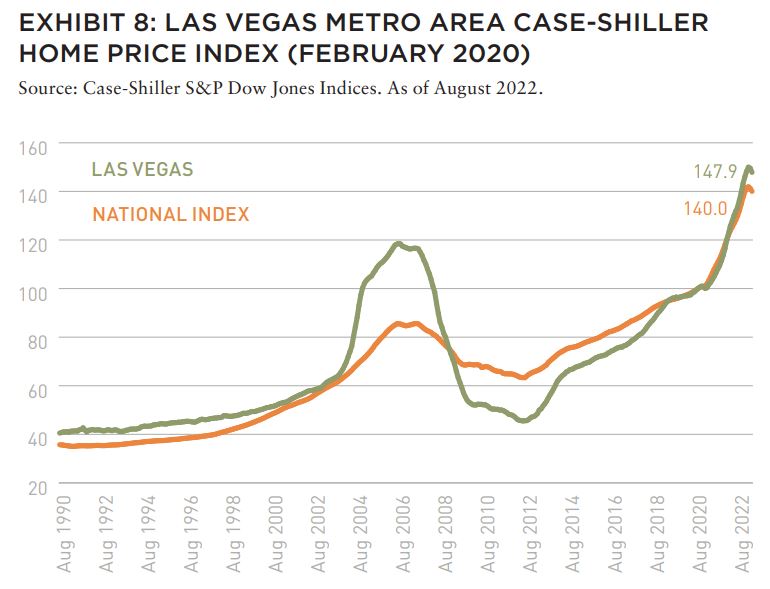
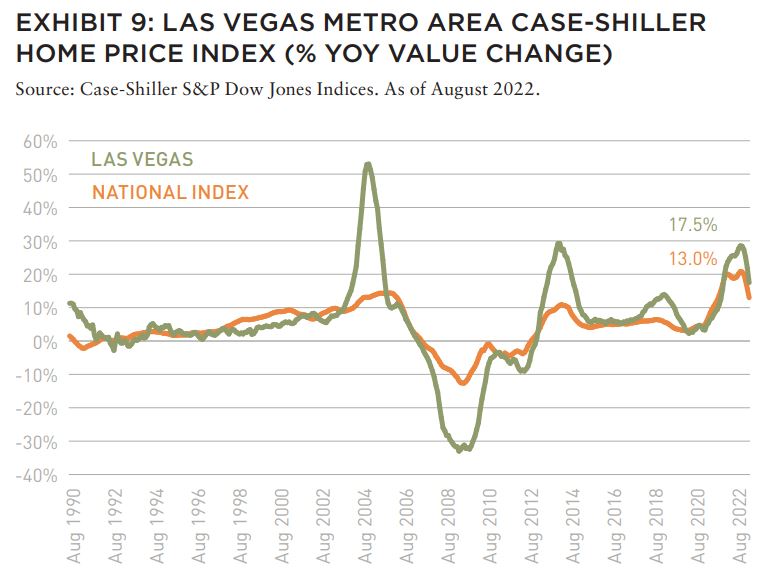
Similar to Phoenix, Las Vegas also experienced a pronounced housing boom which burst in the wake of the GFC. In the three years prior to the peak, home values in Las Vegas increased 88.2%, before declining -61.6% in the wake of the GFC. This peak to trough decline represents the worst of the 20 markets tracked by the Case-Shiller Index. (As noted earlier, in the US, home values rose 28.9% in the three years leading up to the national housing market peak in February 2007, but subsequently fell -26.0% from peak to trough.)
In the run-up to the GFC, growth in home values in Las Vegas reached a peak in September 2004, when home values increased +53.2% on a year-over-year basis. In the trough of the GFC, Las Vegas home values declined -33.0% year-over-year.
Institutional apartment properties also experienced a value runup and subsequent value decline. Apartment values in Las Vegas increased 30.4% year-over-year at its peak in Q2 2006, before declining -28.0% year-over-year during the trough in Q3 2009. By September 2022, Las Vegas apartment values were up 25.1% year-over-year, above the national rate.
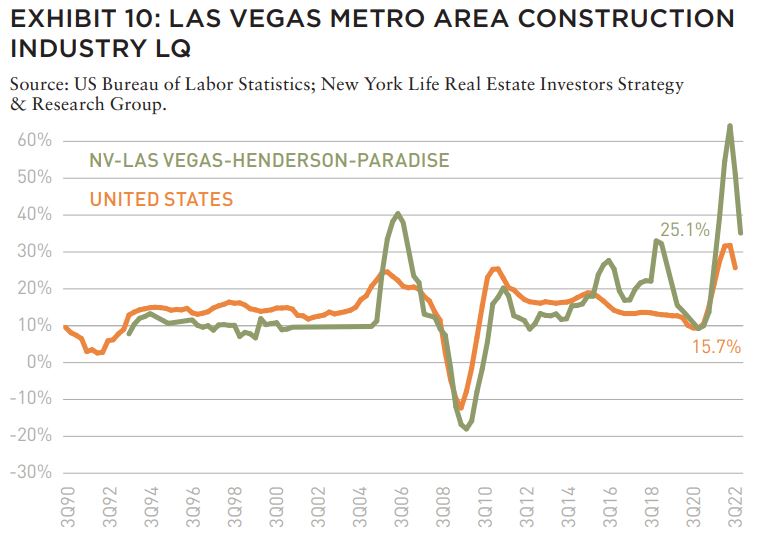
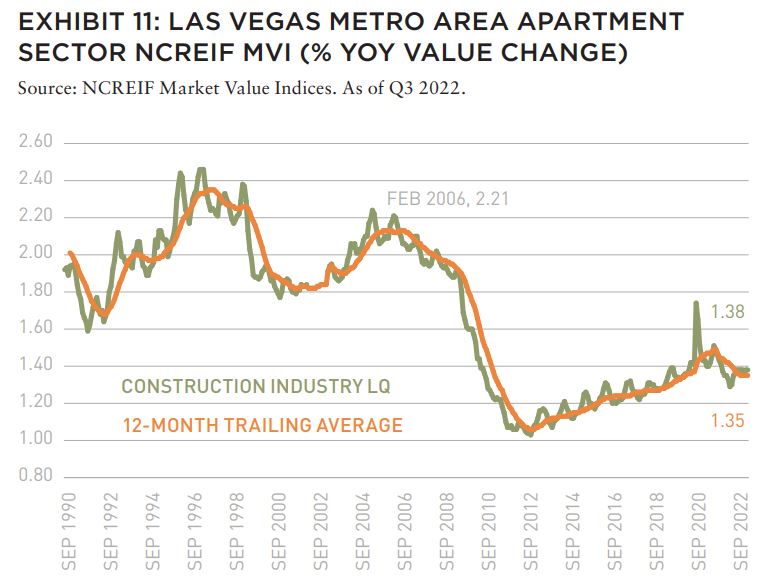
On the eve of the housing crisis, the construction industry made up a disproportionately large portion of the workforce in Las Vegas. In February 2005, the LQ for the construction sector was 2.24, representing 12% of nonfarm payrolls. By September 2022, the construction industry LQ had fallen to 1.38, or about 7% of jobs. This represents the largest reduction in concentration of any major job sector in Las Vegas. Conversely, Reno, another Nevada market, has experienced lesser employment diversification away from construction, having an LQ of 1.86 in September 2006 and 1.62 in September 2022.
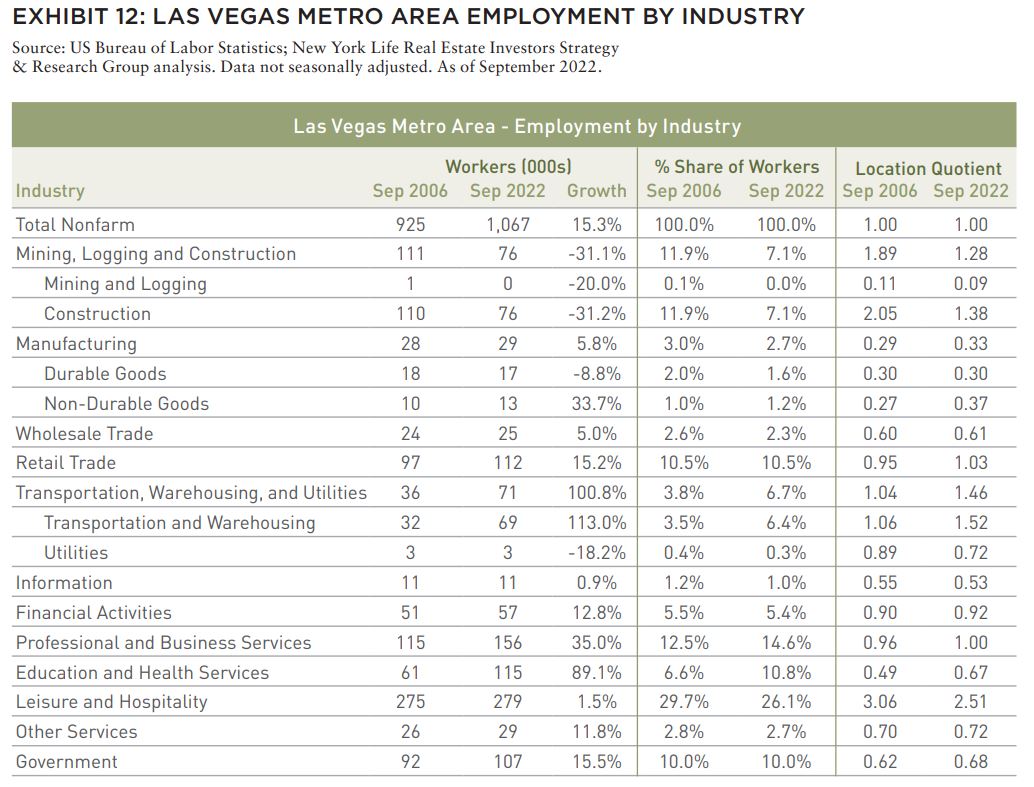
In addition to the construction industry, there are other ways the composition of employment in Las Vegas differs today relative to before the GFC. The TW sector is much larger in 2022—nearly double as a share of jobs compared to 2006. Although extraordinary employment growth in this sector is true across the US, growth in Las Vegas has outpaced the nation, with an increase in LQ from 1.06 in September 2006 to 1.52 in September 2022. This includes overflow demand from tight southern California markets of Los Angeles, Orange County, and Inland Empire. Las Vegas has also experienced small gains in sectors such as education/health services (LQ from 0.49 to 0.67), financial activities (0.90 to 0.92), and professional and business services (0.96 to 1.00).
The leisure and hospitality industry, the largest single industry in Las Vegas, represented an LQ of 3.06 and 29.7% of jobs in September 2006. By September 2022, it had an LQ of 2.51, and represented 26.1% of jobs. The COVID pandemic has likely contributed to this reduction. Nonetheless, with more than a quarter of all jobs in leisure and hospitality, the sector continued to dominate the employment landscape of Las Vegas.
INLAND EMPIRE
Although the Case Shiller Home Price Index does not track the Inland Empire metro area, we can still observe the value decline that occurred for institutional apartment properties.
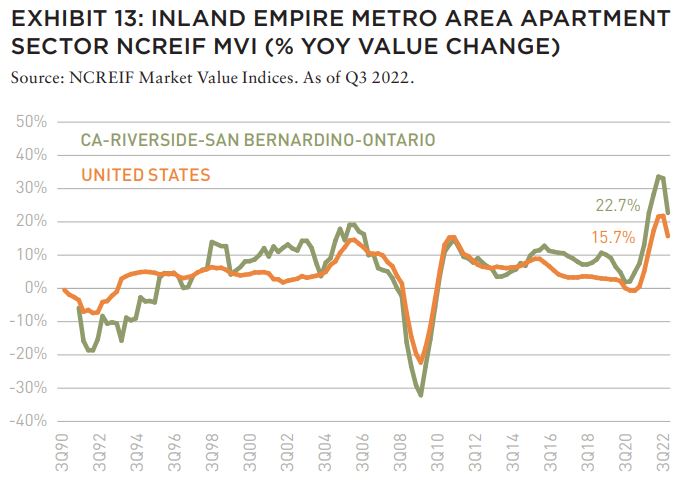
During the GFC, apartments in Riverside-San Bernardino “Inland Empire” experienced value growth of 19.1% year-over-year at its peak in Q4 2005, before declining -32.1% year-over-year during the trough in Q3 2009. By Q3 2022, Inland Empire apartment values were up 22.7% on a year-over-year basis, greater than the US as a whole.
Are Inland Empire housing and apartment prices likely to decline in a similar fashion in a possible 2022–23 recession?
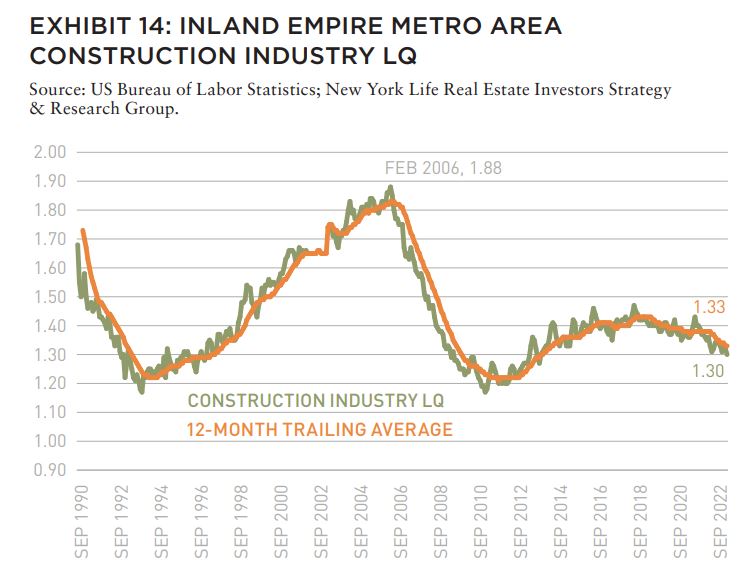
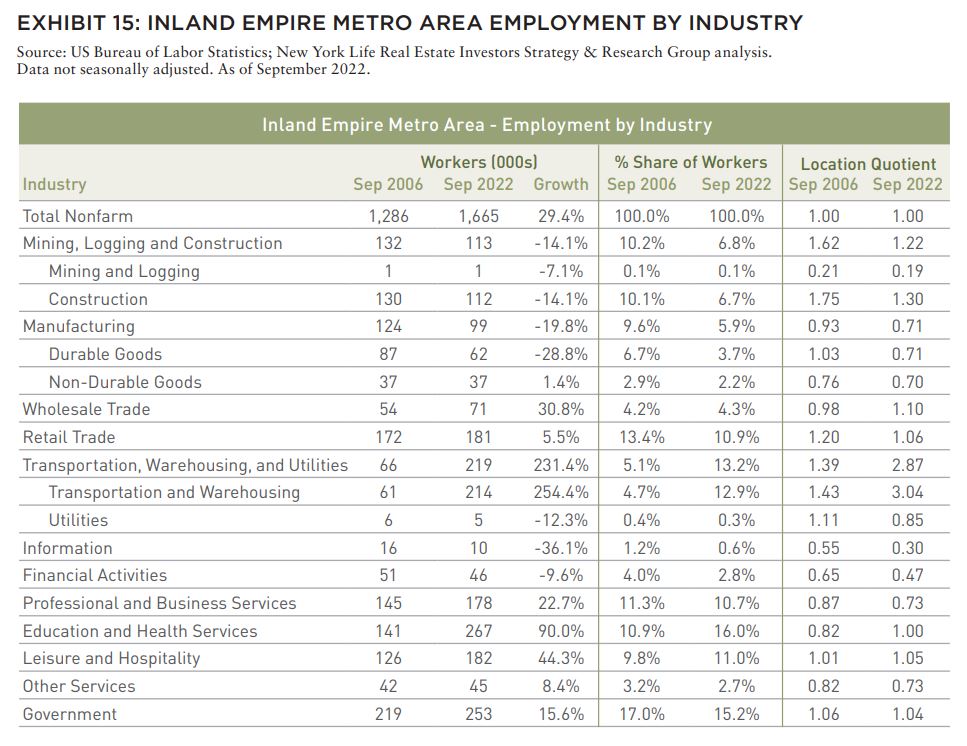
Like the two previously discussed markets, the construction industry was also overrepresented in the workforce of Inland Empire prior to the GFC. The LQ was 1.88 on the eve of the housing crisis (February 2006). However, by September 2022, the LQ had declined to 1.30. As a share of total jobs, the construction industry declined from 10.1% in 2006, to 6.7% in 2022, or a decline of about -14% in the actual number of jobs.
The Inland Empire economy has diversified over this period and is less reliant on construction jobs and the housing industry as it was in the past. Bakersfield and Fresno, two additional metro areas located in California, also experienced similar employment diversification away from construction jobs, with LQs that have fallen from 1.47 and 1.29 in September 2006 down to 1.07 and 1.08, respectively in September 2022.
In addition to employment diversification away from construction labor, Inland Empire has been the beneficiary of extraordinary growth in the demand for TW workers. From 2006 to 2022, the TW sector in Inland Empire grew 254%, increasing as a share of all jobs from 4.7% to 12.9%. Prior to the GFC, the sector had an LQ of 1.43, which even in 2006 was an overconcentration relative to the nation.
Southern California has long been a region with a greater preponderance of logistics properties due to its proximity to the ports of Los Angeles and Long Beach, which each individually are the largest two ports in the US. Because Riverside and San Bernardino counties are inland (as the name suggests) and further from the ports, less expensive land and labor costs render this market desirable. In addition to warehouse and distribution center jobs, transportation jobs in trucking, rail, and other categories accompany this form of economic activity.
Beginning with the COVID-19 pandemic, the surge in demand for e-commerce goods resulted in accelerated demand for logistics space and substantial growth in the TW employment sector. In September 2022, the LQ for Transportation and Warehousing was 3.04, the highest in the nation and a substantial increase from pre-GFC, the highest increase among metro areas tracked by the Bureau of Labor Statistics.
Consequently, because the Inland Empire economy is more diversified, principally away from the construction industry, the negative effects may be muted relative to during the GFC.
TAMPA
Tampa is another example of a market that experienced a more severe housing boom and bust than the rest of the nation during the GFC. In the three years prior to the pre-GFC peak, home values in Tampa increased 73.0%, before declining -47.6% in the wake of the GFC. In the US as a whole, home values rose 28.9% in the three years leading up to the national housing market peak in February 2007, but subsequently fell -26.0% from peak to trough.
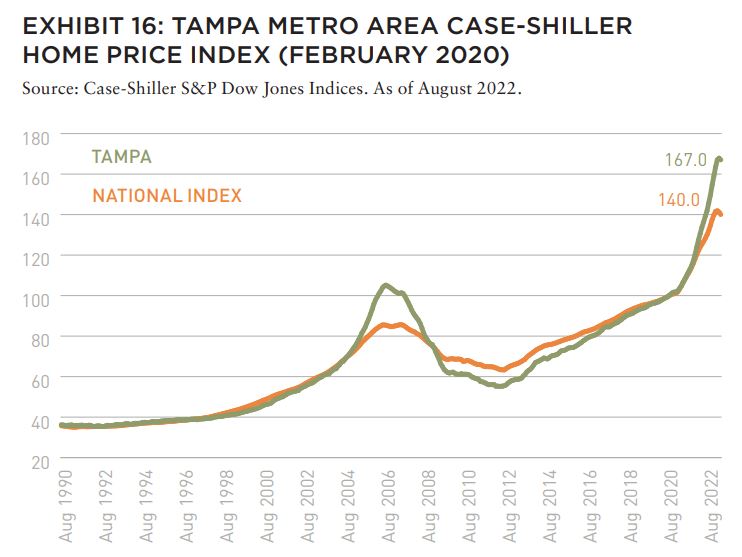
In the run-up to the GFC, growth in home values in Tampa reached a peak in November 2005, when home values increased +30.7% on a year-over-year basis. At the lowest point of the GFC, Tampa home values had declined -23.3% year-over-year.
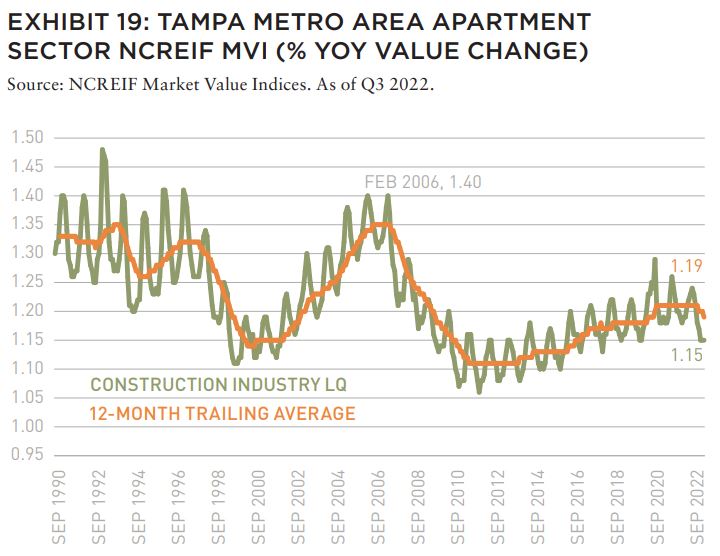
During the GFC, the value of institutional apartment properties in Tampa experienced similar dynamics to home values. Tampa apartment property values increased 35% year-over-year at its peak in Q1 2006, before declining -25.1% year-over-year during the trough in Q3 2009. By Q3 2022, Tampa apartment values were up 29.4% year-over-year, nearly double the rate of growth in the US.
Are Tampa housing and apartment prices likely to decline in a similar fashion in a possible 2022–23 recession?
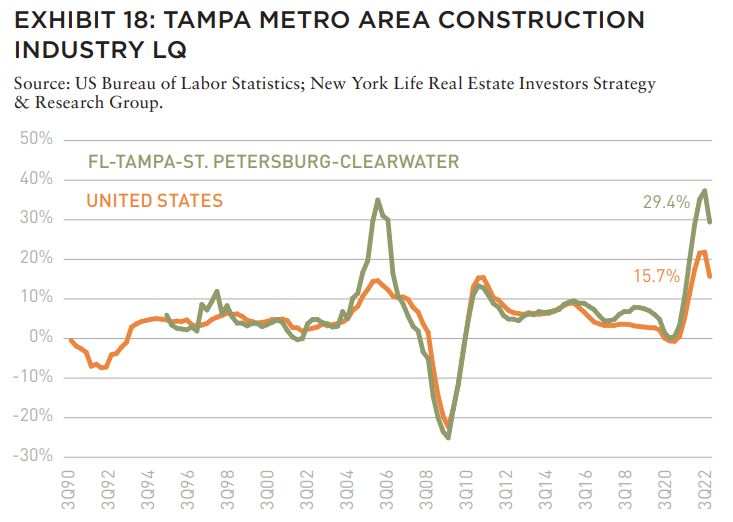
The theme of a reduction in the concentration of construction jobs in Sand State markets since pre-GFC is true in Tampa as well. The construction industry LQ was 1.40 on the eve of the housing crisis (February 2006). However, as of September 2022 it has declined to 1.15. As a share of all jobs, this is a decline from 7.7% to 6.0%. This demonstrates that the Tampa economy has diversified away from construction jobs and is not as reliant on them or the housing industry as it was in the past. This employment shift in Tampa is also characteristic of other metro areas in Florida, a Sand State, including Orlando, Miami, Tampa, and Jacksonville. Orlando, which had the heaviest reliance on construction labor, has also seen the greatest improvement with job LQ down from 1.49 in September 2006 to 1.09 in September 2022.
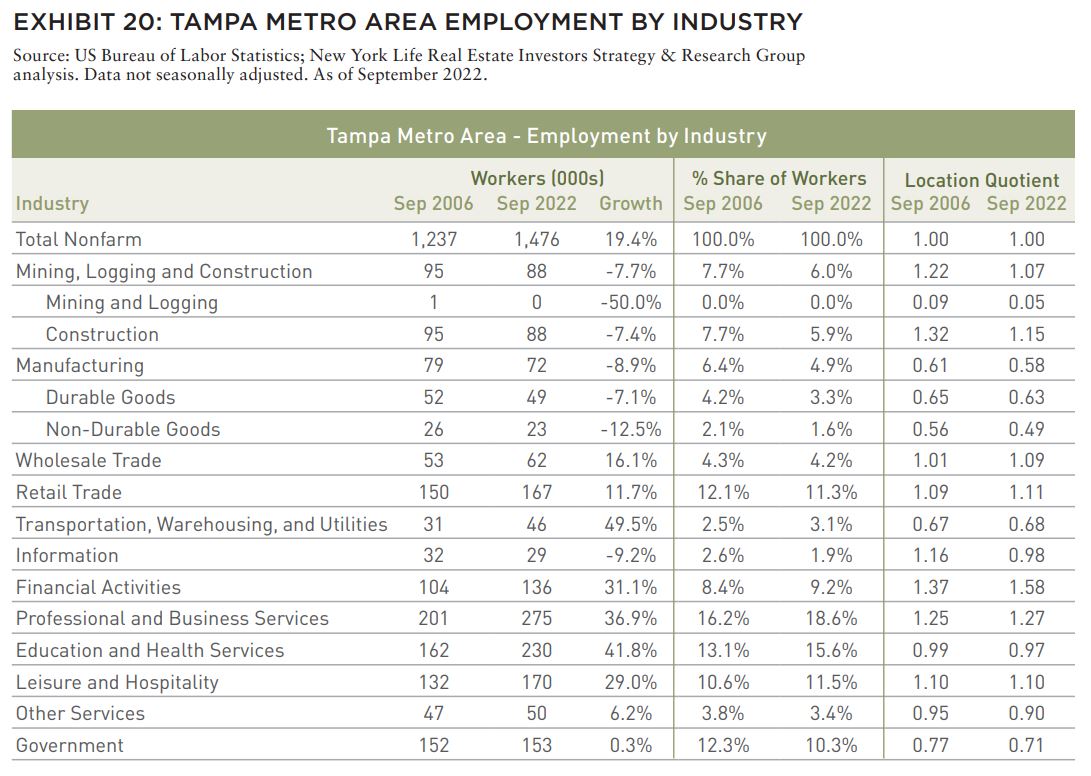
In addition to a smaller construction industry, Tampa has seen the manufacturing (both durable and non-durable goods) industry decline in size, as well as the Information sector. Conversely, the financial activities jobs sector has grown from an LQ of 1.37 to 1.58. Although the number of transportation, warehousing, and utilities jobs increased nearly 50% from 2006 to 2022, the LQ only increased from 0.67 to 0.68.
MIAMI
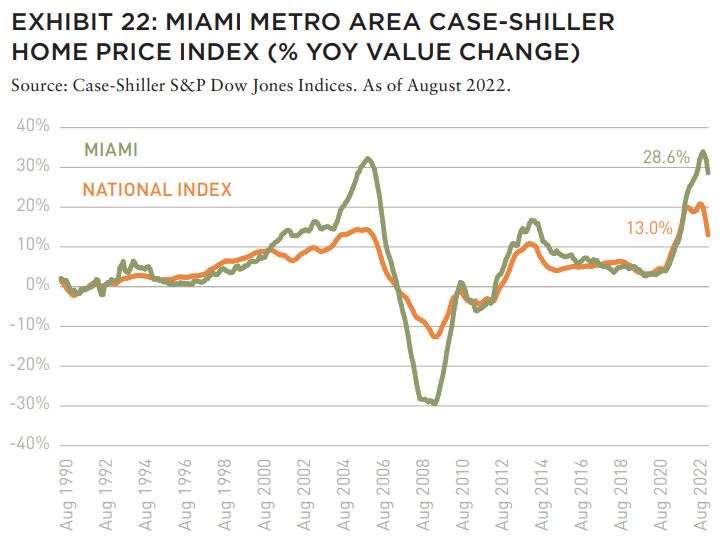
In addition to Tampa, Miami experienced a severe housing boom and bust during the GFC. In the three years prior to the pre-GFC peak, home values in Miami increased 67.5%, before declining -51.0% in the wake of the GFC. In the US as a whole, home values rose 28.9% in the three years leading up to the national housing market peak in February 2007, but subsequently fell -26.0% from peak to trough.
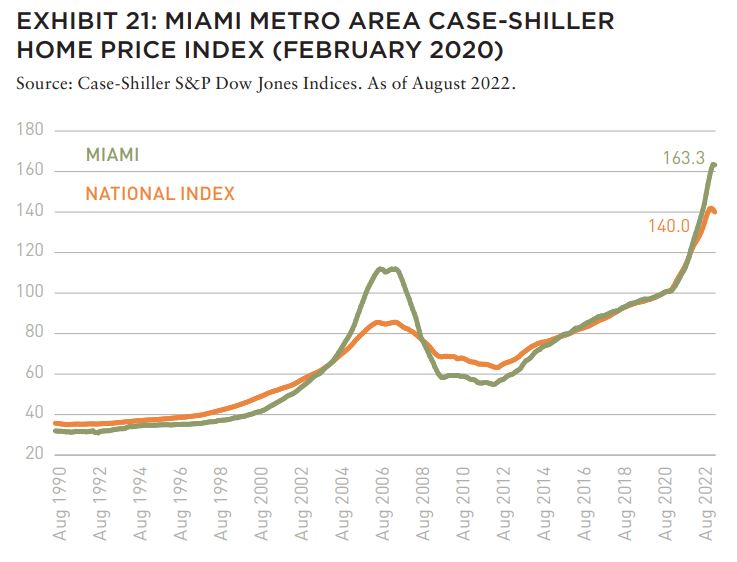
In the run-up to the GFC, growth in home values in Miami reached a peak in November 2005, when home values increased +32.3% on a year-over-year basis. At the trough point of the GFC, Miami home values had declined -29.5% relative to a year prior.
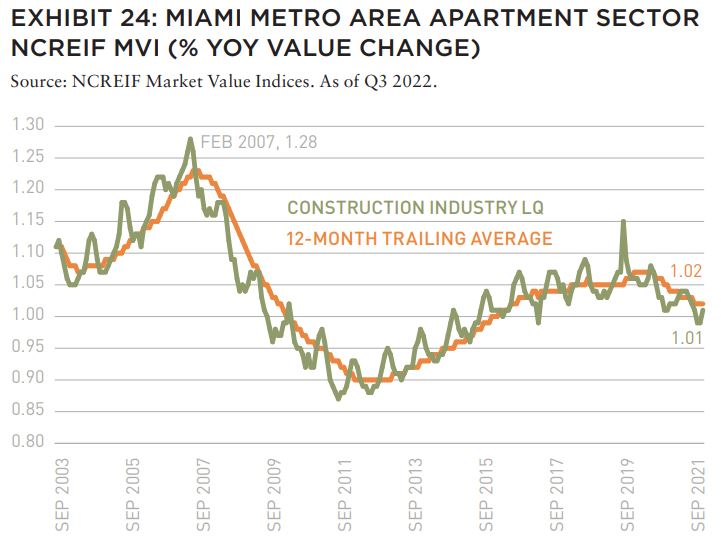
During the GFC, the value of institutional apartment properties in Miami experienced similar dynamics to home values. Miami apartment property values increased 28.7% year-over-year at its peak in Q4 2006, before declining -29.1% year-over-year during the trough in Q3 2009. By Q3 2022, Miami apartment values were up 28.4% year-over-year, outperforming the nation as a whole.
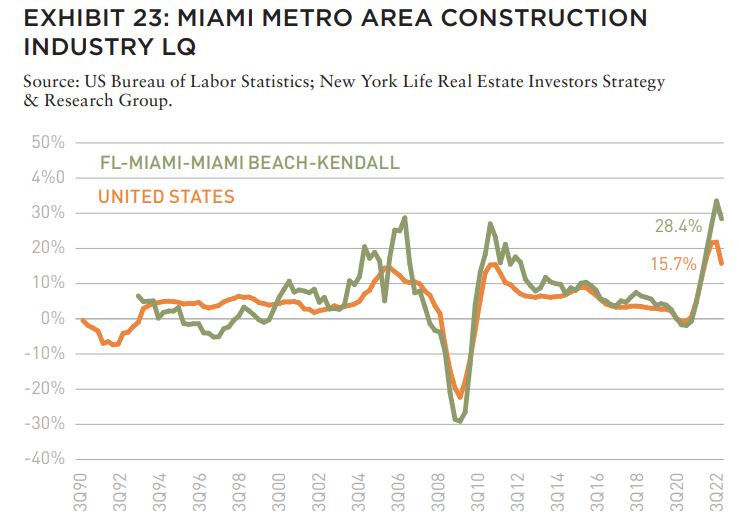
Are Miami housing and apartment prices likely to decline in a similar fashion in a possible 2022–23 recession? The theme of a reduction in the concentration of construction jobs in Sand State markets since pre-GFC is true in Miami as well. The construction industry LQ was 1.28 on the eve of the housing crisis (February 2007). However, by September 2022 it had declined to 1.01. As a share of all jobs, this is a decline from 7.0% to 5.2%. This demonstrates that the Miami economy has diversified away from construction jobs and is not as reliant on them or the housing industry as it was in the past. As noted earlier, this employment shift in Miami is also characteristic of other metro areas in Florida.
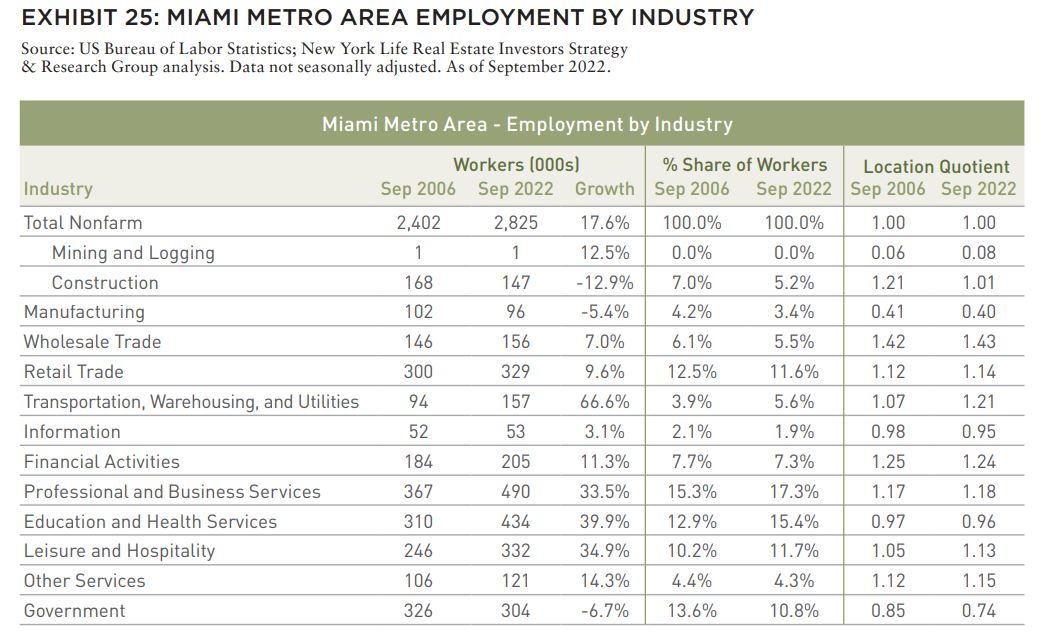
Miami’s manufacturing employment base has also declined, from an LQ of 1.21 in 2006 to 1.01 in 2022. The Professional and Business Services sector has grown from 15.3% of all jobs in 2006, to 17.3% in 2022. Although, the financial activities sector share of jobs declined between 2006 and 2022, announcements from financial fi rms relocating or increasing their presence in the Miami area means the number of these jobs will likely increase. In June, Chicago-based Citadel Securities announced plans to move its headquarters to Miami. This announcement comes after other financial services, tech firms, and adjacent PBS companies created or increased their presence in the Miami metro area.
Similar to elsewhere in the country, the number of TW jobs increased substantially over the past decade. This is particularly true in Miami, which has grown as a logistics hub for a rapidly growing population. With that, has come a 66.6% increase in transportation, warehousing, and utilities jobs between 2006 and 2022.
WHAT’S NEXT FOR SAND STATES?
A housing correction has begun and will likely have a negative impact on the economic health and commercial real estate values of noted Sand State metros. Higher borrowing costs, general unaffordability, stagnant real wages, and a possible recession are likely causes. It would follow that a housing decline would likely have a particularly adverse effect on the economic health and commercial real estate values of markets more severely impacted by a recalibration in housing prices.
In the wake of the GFC, certain metros in the Sand States suffered disproportionally. Fewer barriers to construction including more easily available developable land and lower regulatory hurdles expose these metros to above average risk of overbuilding and boom/bust cycles in the construction industry relative to other markets. When homebuilding declined during the GFC, an overconcentration of construction labor disproportionately impacted the overall economic health of these markets.
Although there are factors that may continue to render some markets exposed to these cycles, the economies of the five discussed subject metros have become more diversified, notably, away from the construction industry. This set of circumstances may result in a future setback that is smaller in magnitude relative to the one experienced during the Global Financial Crisis.
EXPLORE THE LATEST ISSUE

MAKE SUSTAINABILITY REAL
With the case for sustainability already well-established, how can (and should) real estate continue to lead?
Gunnar Branson | AFIRE
RETURN GENERATION POTENTIAL
In addition to offering inflation protection and lower volatility, real estate also offers something that other asset classes can’t: the opportunity to invest in tangible, positive change.
Shane Taylor | CBRE Investment Management
CATCH A FALLING *R
The future path of long-term interest rates in the US and why it matters.
Alexis Crow, PhD | PwC
TIDAL PATTERNS
Amidst myriad global economic and geopolitical uncertainties, US commercial real estate has an even greater challenge ahead: demographics.
Martha S. Peyton and Caitlin Ritter | Aegon Asset Management
WORKPLACE VALUES
The sooner we can recognize that values have come down collectively—even beyond the office sector—the sooner we can move forward to capitalizing on new opportunities.
Dags Chen, CFA | Barings Real Estate
OFFICE GAMES
Even as the US office sector has lagged other property types, there could be an important (and valuable) difference of office performance based on property age and market.
William Maher and Scot Bommarito | RCLCO
EMISSION CRITICAL
Workers spending less time in the office post-pandemic may seem negative for the office sector, but a four-day workweek can be a boon for some office property owners.
Kevin Fagan, Xiaodi Li, and Natalie Ambrosio Preudhomme | Moody’s
MOVING TARGETS
A close-in look at twenty major US metros and thousands of properties shows how the overall impact of rising expense loads have narrowed NOI margins. Investors should take note.
Gleb Nechayev, CRE and Webster Hughes, PhD | Berkshire Residential Investments
SAND STATES
In the wake of the Great FinancialCrisis, certain metros in the Sand States suffered disproportionally. It may not be as bad this time.
Stewart Rubin and Dakota Firenze | New York Life Real Estate Investors
STORM WARNING
Not all storms are the same, and some are so tragic that they force a moment of universal recalibration. Hurricane Ian was one of those storms—but what does that mean for real estate?
Rajeev Ranade and Owen Woolcock | Climate Core Capital
PACIFIC THEATER
The Asia-Pacific region is already home to some of the world’s largest economies and now set to lead global economic growth. What’s moving the needle now for the APAC region?
Simon Treacy and Yu Jin Ow | CapitaLand Investment
STABLE SPACE
For e-commerce property investors, the past decade was outstanding, but even as market dynamics are slowing industrial’s momentum, market fundamentals remain sound.
Mehta Randhawa | JLL
—
ABOUT THE AUTHORS
Stewart Rubin is Senior Director and Head of Strategy and Research, and Dakota Firenze is a Senior Associate, for New York Life Real Estate Investors, a division of NYL Investors LLC, a wholly-owned subsidiary of New York Life Insurance Company.5
—
NOTES
1. Inland Empire is a term used to refer to the Riverside–San Bernardino–Ontario metro area.
2. Their abundance of either beaches or deserts has led some observers to refer to them as “Sand States.”
3. Inland Empire (Riverside/San Bernardino) market is not tracked by the Case Shiller Home Price Index.
4. TEU, or a twenty-foot equivalent unit, is a measure of volume in units of twenty-footlong shipping containers. Large container ships typically transport 18,000–21,000 TEUs.
5. NYL Investors LLC: The information presented has been prepared by Real Estate Investors for informational purposes only and sets forth our views as of this date. The underlying assumptions and our views are subject to change. This does not constitute investment advice and should not be used as a basis for any investment decision. There is no guarantee that market expectation will be achieved.
The comments, opinions, and estimates contained herein are based on and/or derived from publicly available information from sources that Real Estate Investors believes to be reliable. We do not guarantee the accuracy of such sources or information.
No part of this material may be i) copied, photocopied, or duplicated in any form, by any means, or ii) redistributed without Real Estate Investors prior consent.
Real Estate Investors is an investment group within NYL Investors LLC. NYL Investors LLC (“NYL Investors”) is a direct wholly-owned subsidiary of New York Life Insurance Company. NYL Investors is comprised of the following investment groups: (i) Fixed Income Investors, (ii) Private Capital Investors and (iii) Real Estate Investors.
NYL Investors is not registered in every jurisdiction and their products or services are not available, and materials relating to them will not be distributed, to any person domiciled in any jurisdiction or region where such distribution would be contrary to local law or regulation.
NYL Investors affiliates may develop and publish research that is independent of, and different than, the views expressed.
—
REVIEWER RESPONSE
Writing on the likely cusp of recession, Rubin and Firenze offer a timely reflection on the differential impact of the Great Financial Crisis on five American markets and how these markets have evolved in the years since.
A common thread connecting Phoenix, Las Vegas, the Inland Empire, Tampa, and Miami during the housing boom was a heavy reliance on the residential sector and home construction as drivers of economic activity and employment. With boom turning to bust, these markets are cited by the authors for their particularly severe housing market downturns and contributions to the cascade of fractures in the US financial system.
More than fifteen years after the Sand States’ housing apex, the authors point to evidence of greater diversification in economic activity and a lower reliance on housing as reasons to expect they will fare better this time around. More measured housing activity, observable in local and national data, is a feature of markets across the country. It also coincides with other key differences between the GFC and the current cycle which argue for lower vulnerability in the housing sector. During the former, housing was oversupplied and investment demand surpassed real demand. Presently, housing is relatively undersupplied, particularly in the workforce and affordable segments; real demand was robust until succumbing to the most abrupt increase in mortgage rates since the early 1980s.
Owing in part to changes in the regulatory framework, today’s outstanding mortgages pool compares favorably to any housing boom benchmark. While single-family homeownership faces significant headwinds, housing’s more balanced contribution to activity—in the authors’ focus markets and elsewhere— rightly suggest it will exert less downward pressure on the outlook.
THIS ISSUE OF SUMMIT JOURNAL IS PROUDLY SUPPORTED BY


Our focus on delivering results is driven by our values, entrepreneurial spirit and our clients’ diverse needs. Together, our team specializes in holistic real assets solutions within and across five real assets investment categories, with a distinct approach to driving performance and long-term value.
CBRE Investment Management is a leading global real assets investment management firm with $143.9 billion in assets under management as of September 30, 2022, operating in more than 30 offices and 20 countries around the world. Through its investor-operator culture, the firm seeks to deliver sustainable investment solutions across real assets categories, geographies, risk profiles and execution formats so that its clients, people and communities thrive.
CBRE Investment Management is an independently operated affiliate of CBRE Group, Inc. (NYSE:CBRE), the world’s largest commercial real estate services and investment firm (based on 2021 revenue). CBRE has more than 105,000 employees (excluding Turner & Townsend employees) serving clients in more than 100 countries. CBRE Investment Management harnesses CBRE’s data and market insights, investment sourcing and other resources for the benefit of its clients. For more information, please visit cbreim.com.